Metals Always Push To The Limit
As the metals developed this pullback over the last two weeks, it broke below our upper support regions. Clearly, that caused some concern, and still causes me to retain some concern, as I am not happy about the depth of this pullback as it relates to the larger bullish posture into the end of the year. But, the structure of the initial drop pointed to levels a bit lower which could still keep us within a bullish pattern to the upside, and we posted this early last week. Today, we are testing those levels.
Moreover, when we watch support levels, we often see how the metals will spike those levels, only to reverse strongly. That is why it is just as important to understand where those levels reside, along with understanding the structure which with we hit those levels.
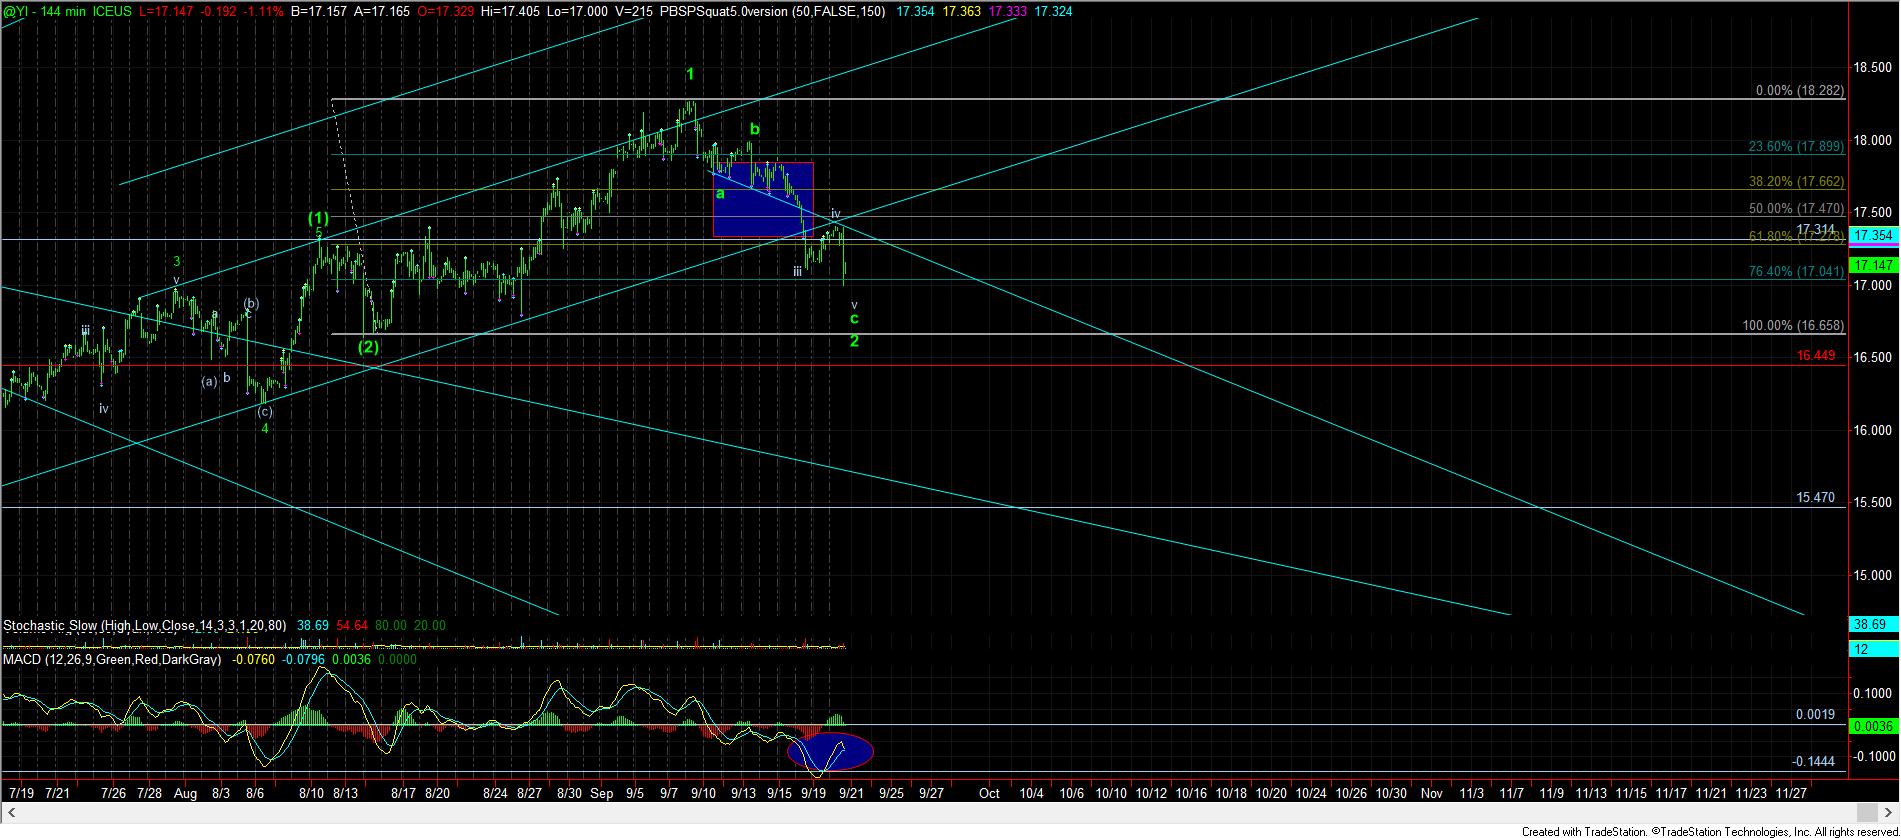
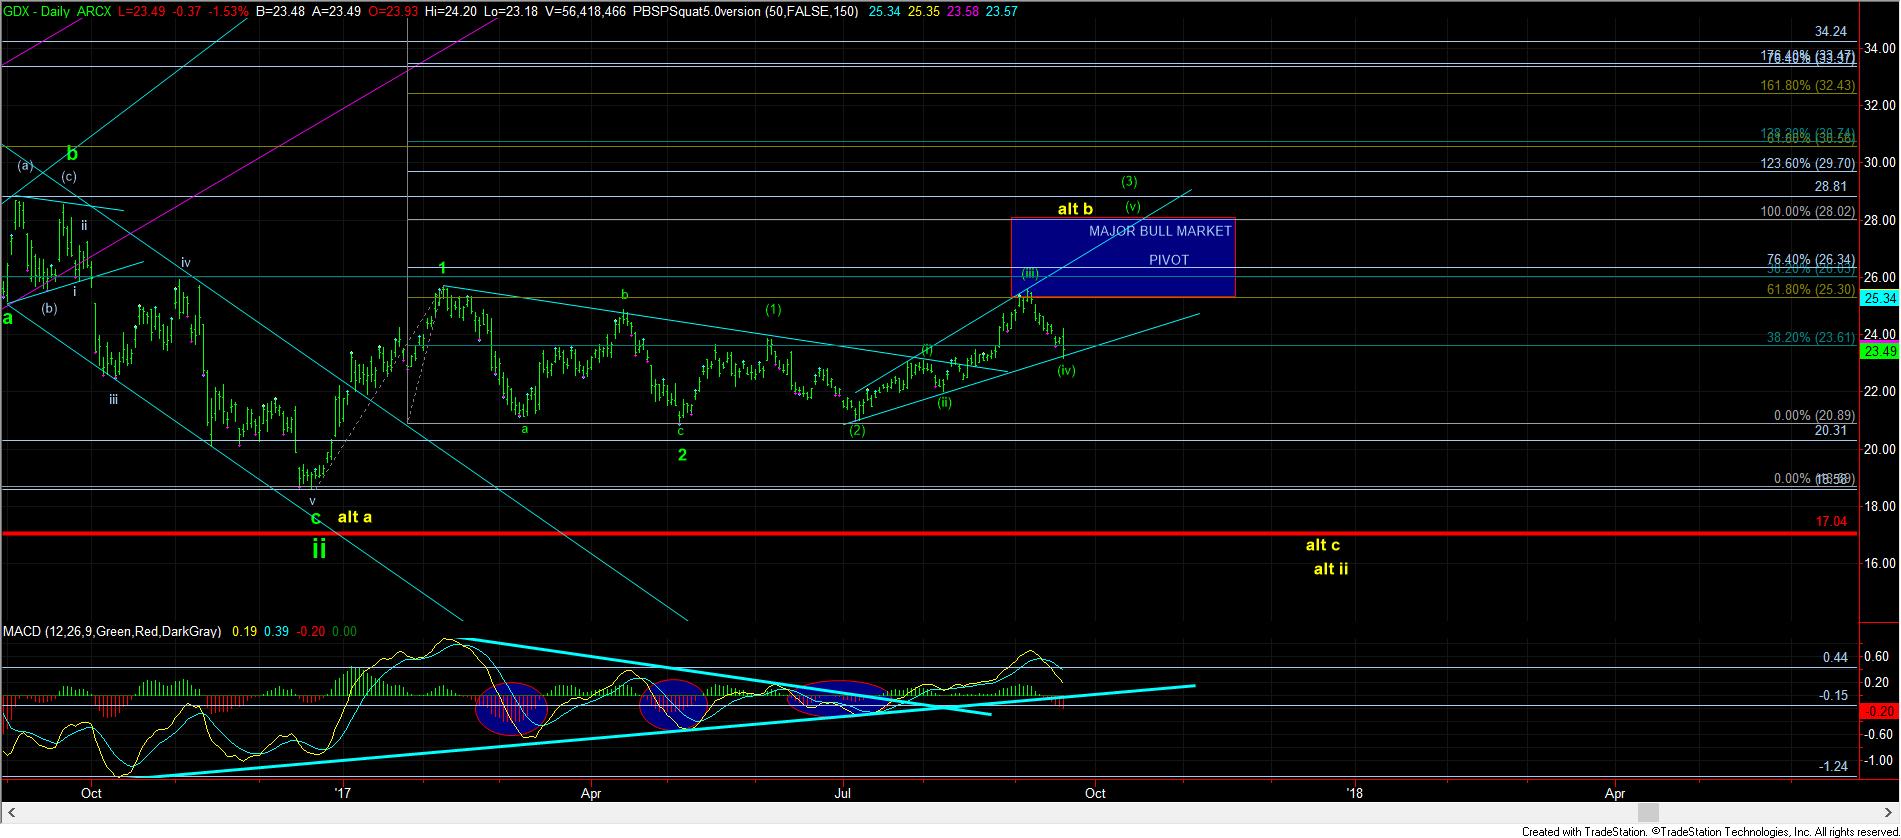
For now, GDX has spiked just below its support region, and may try for a double bottom, but the overall structure looks to be suggestive of its bottoming. Moreover, silver has now dropped in what we are counting as wave v of c of 2, which would still be a VERY bullish posture if silver were to follow through in this count.
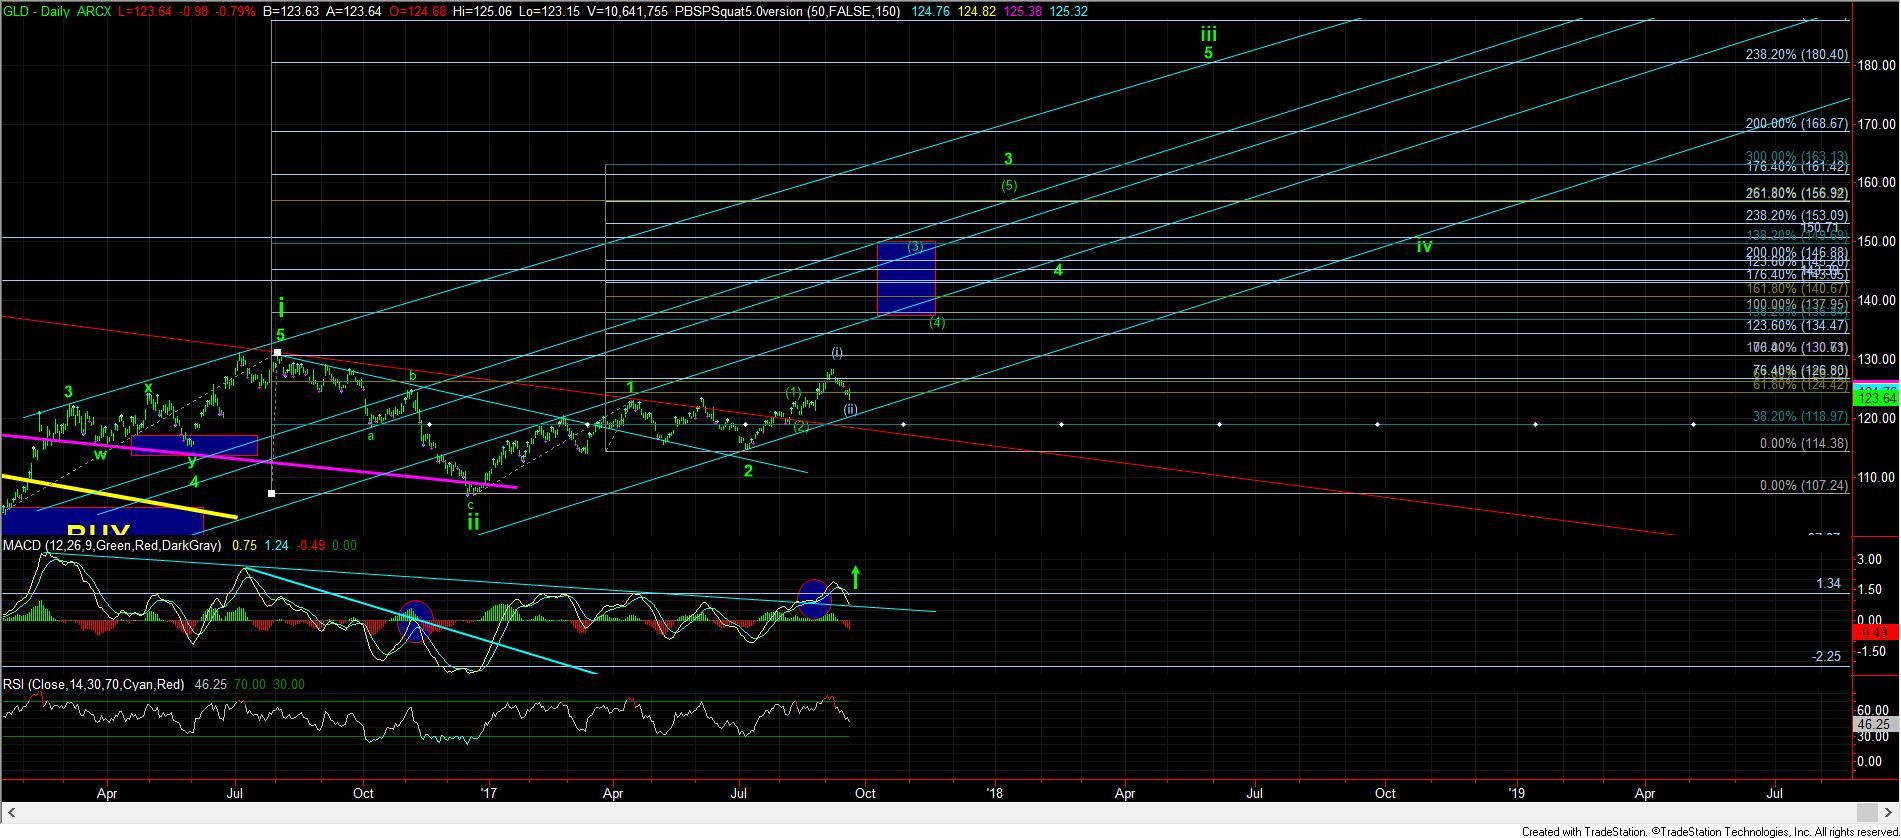
This brings me to the cleanest count at this time, and that is the GLD. I am counting GLD similarly to silver – as a 2nd wave pullback. But, it does concern me that I really do not have the same count in the GDX. Rather, the GDX is telling me that I have to turn much more cautious on the complex should we be able to rally over the 26 level in the coming weeks.
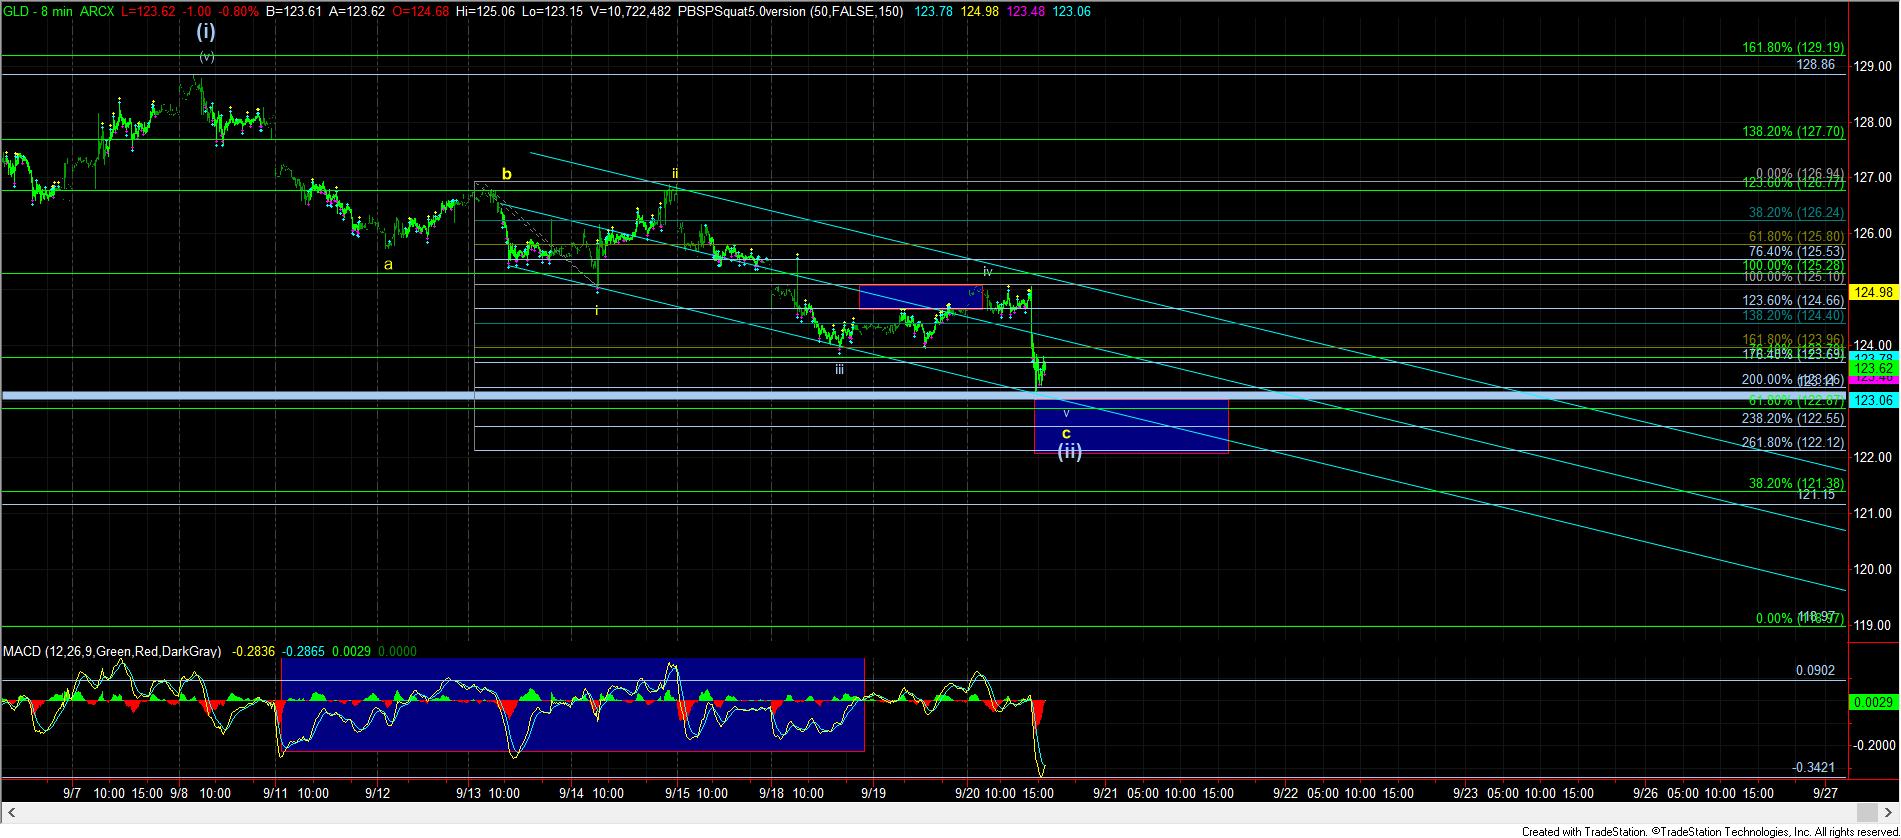
So, for now, I am expecting a rally to be setting up in the metals complex. As I noted over the weekend, as long as we remain below the wave iv resistance box, I believe we can drop towards the 123 region to complete a 5th wave down. Currently, the micro count has us having either completed wave v of v of (ii), or just in a micro 4th within wave v of c of (ii). That certainly leaves the door open for a micro lower low in the complex later this week. This means that the market “should” hold the 122.50 region if this is the correct count. A strong break of 122.50 with follow through below 122 would not be in line with the immediate bullish perspective, and it is not what I am expecting at this point in time.
Since the GLD really is the cleanest count, I would you to look closely at the MACD on the daily chart. We have a clear break out in the MACD through the downtrend channel, and this pullback is testing that channel from above. This is typical action in a bull market, so the daily GLD chart still has me viewing the market as bullish.
Lastly, as I mentioned earlier this week, I wanted to see a lower low with a positive divergence on the silver chart. That is what we got today.
So, for now, I am still going to retain a bullish expectation over the coming weeks. And, if GLD were to strongly break 122.50, with follow through below 122, I would have to reconsider my perspective.