Metal Charts Still Vary Greatly
The action seen on Wednesday made sense in some charts but lacked follow through in others.
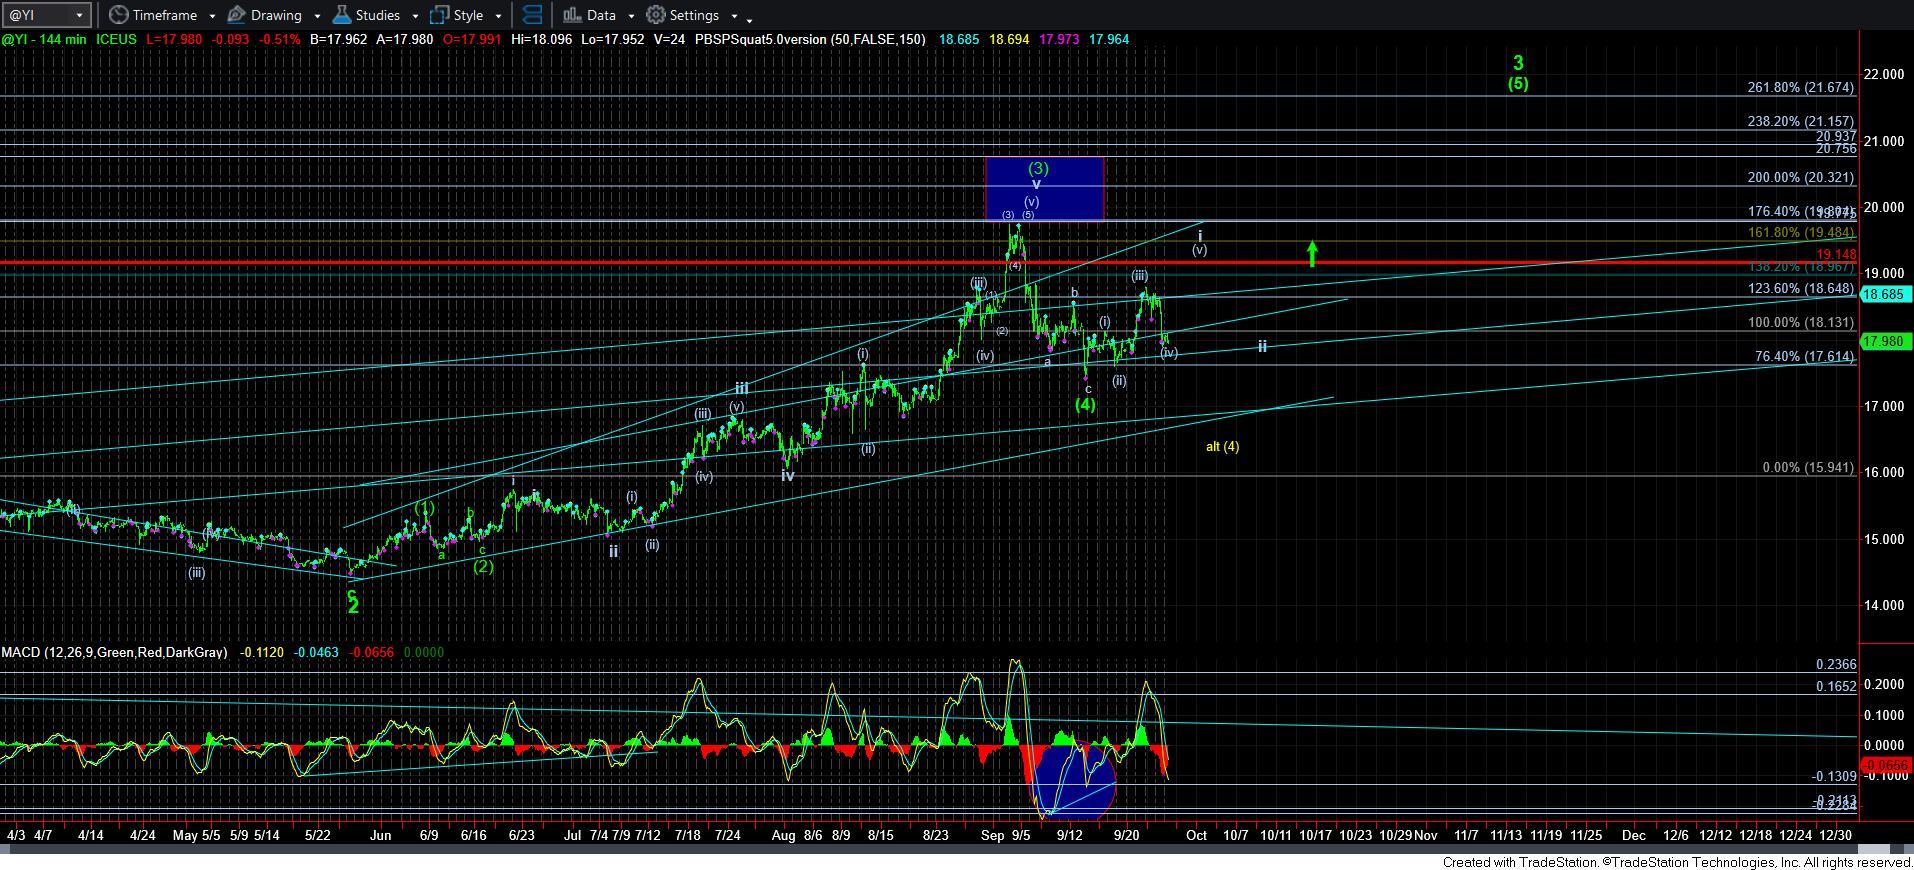
As silver has been so well behaved of late, the break down has certainly not fallen in line with my ideal expectations. At this time, I have to begin to consider that the pullback off the 19.72 high may not yet be done. While this can still be a 4th wave pullback in a diagonal, I would need to see that higher high to suggest this is the case. But, until we see such a higher high to suggest that something more bullish is playing out, I may have to assume that we can break below 17.43 low before this pullback completes.
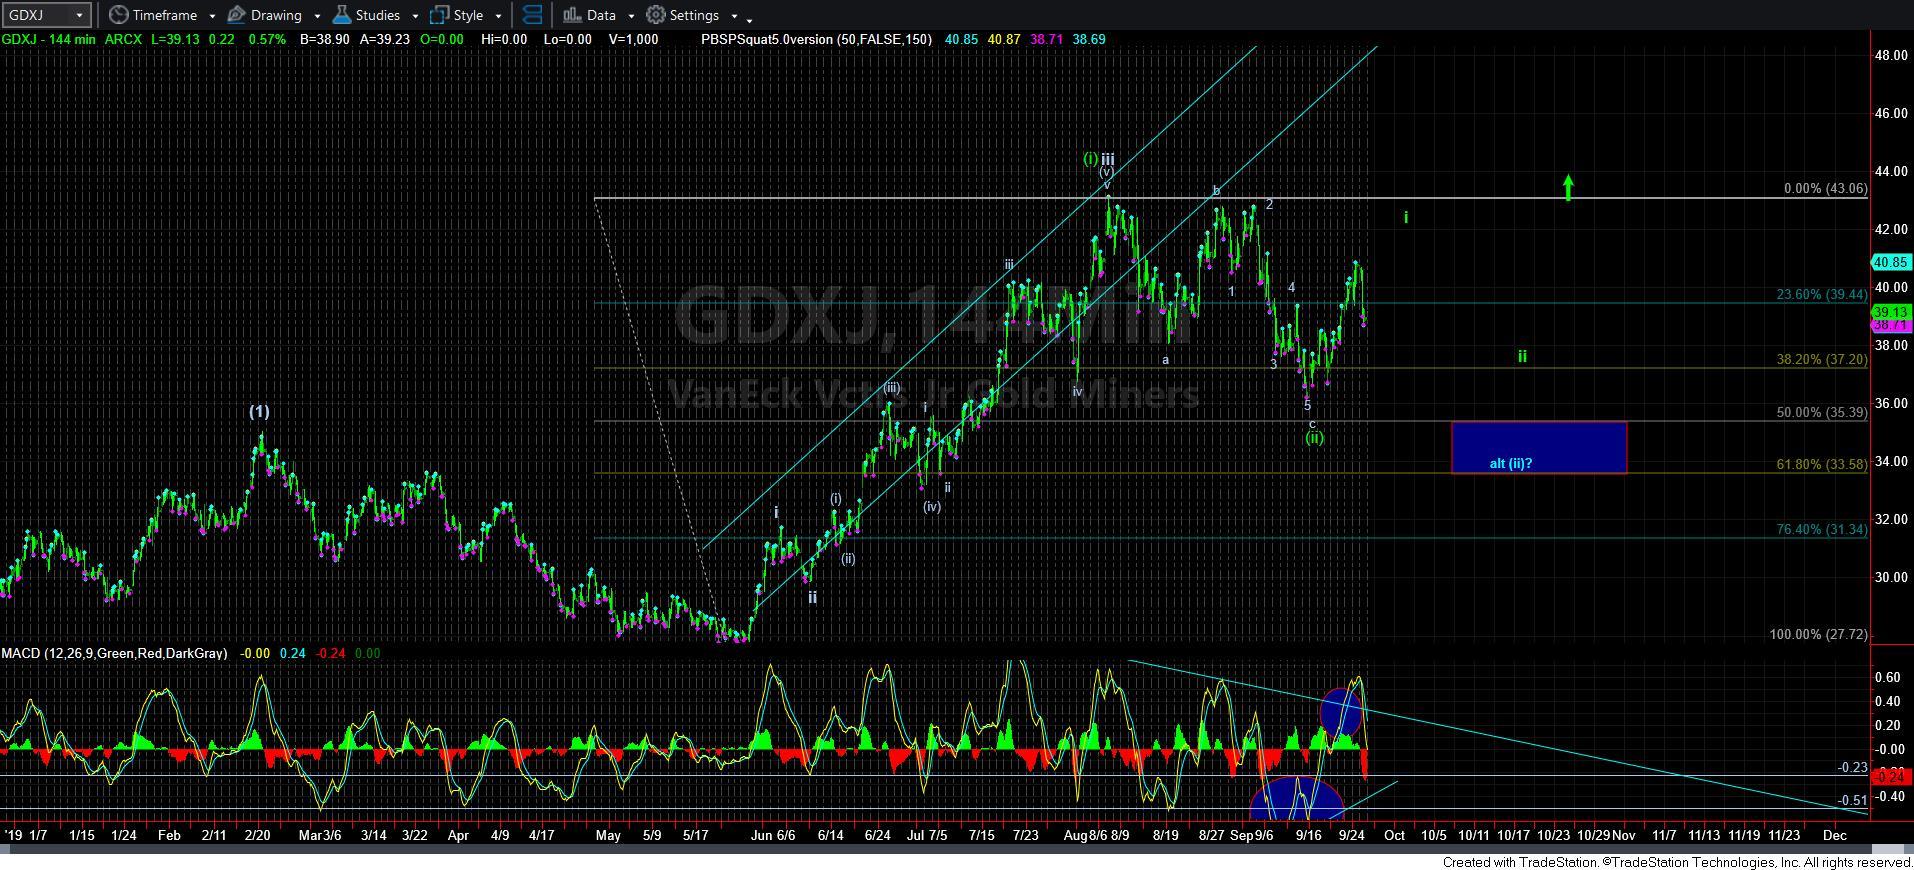
And, the exact same scenario seems to apply across the board. Most specifically, the GDXJ would also need a higher high to suggest that this rally will complete 5-waves up off the recent lows. Otherwise, I have to expect that we will return to the 33.50-35 region over the coming weeks in a more drawn out wave (ii).
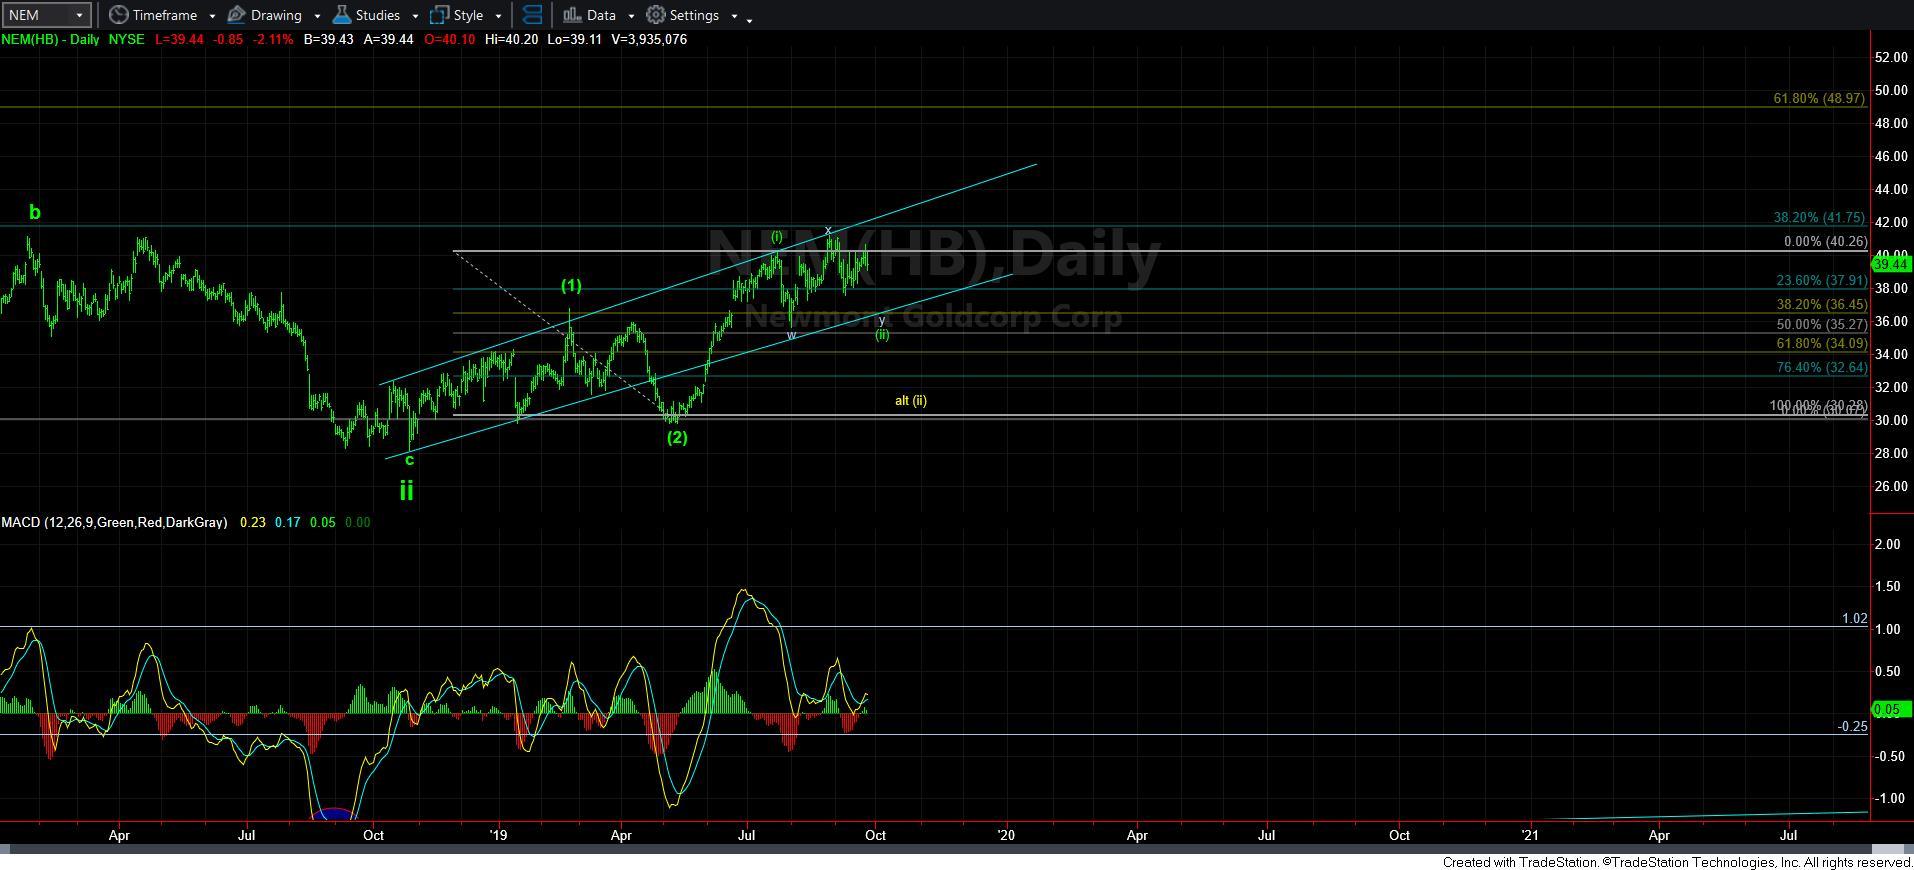
Yet, I have been continually harping on the fact that I cannot get immediately bullish until NEM is able to break out strongly over the 41 region. This chart has been strongly suggestive that this pullback has not yet run its course.
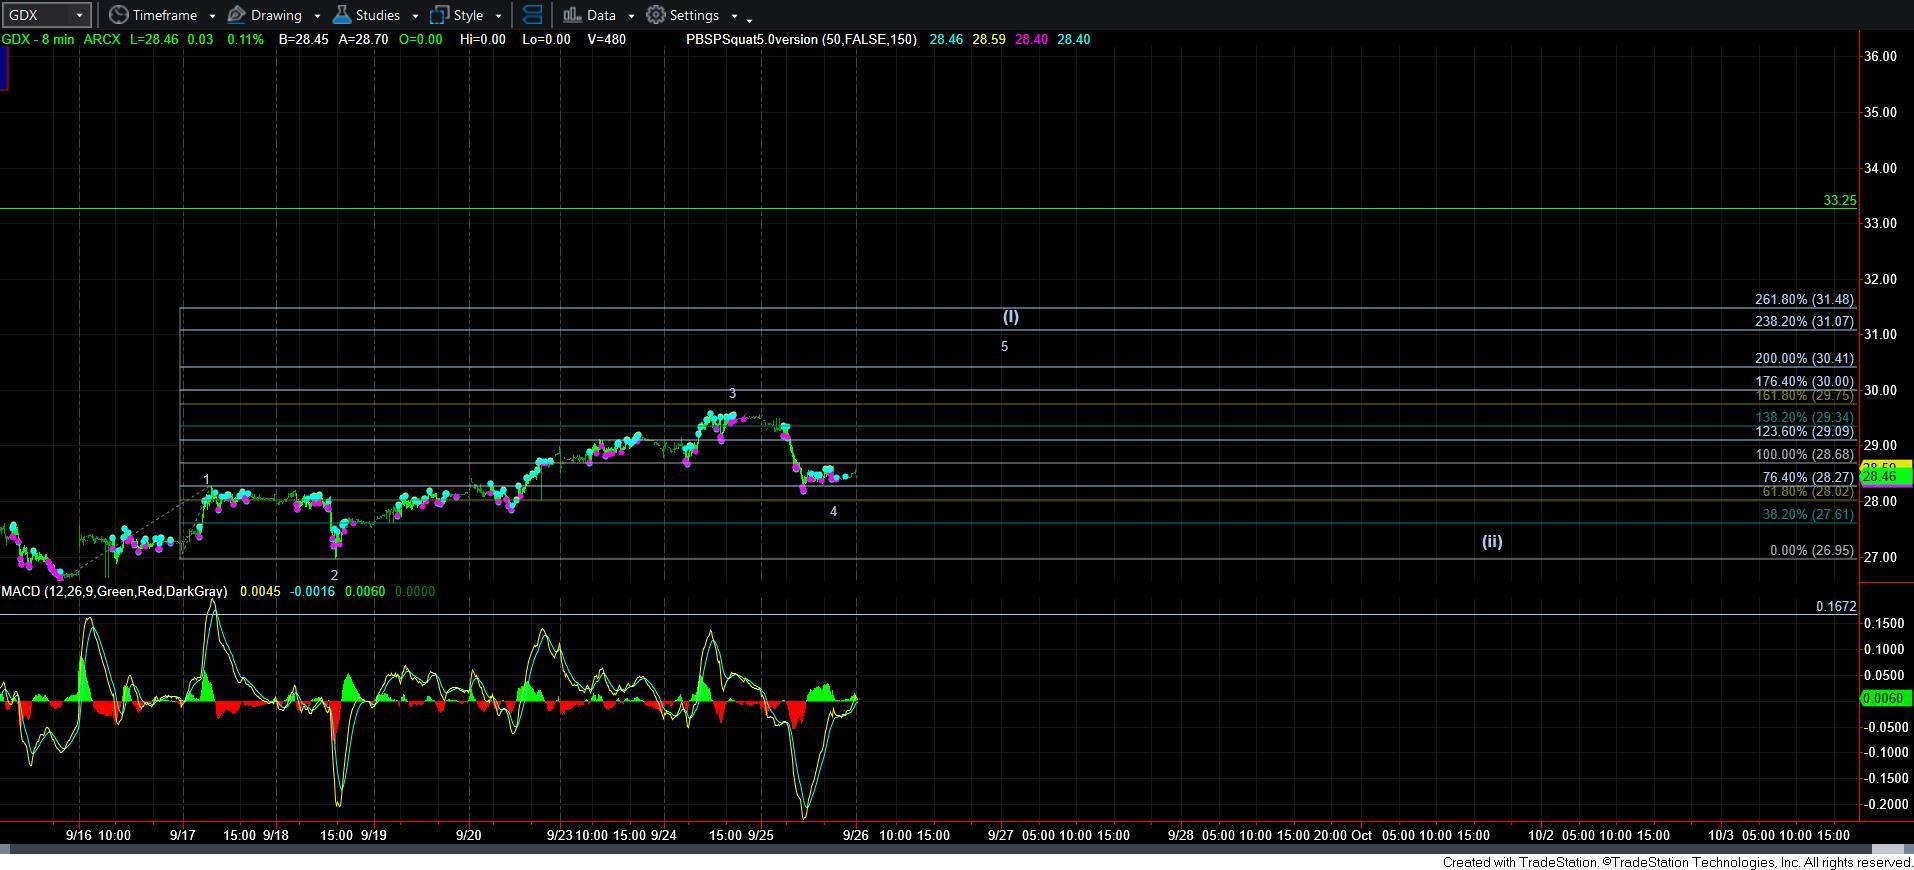
In this update, I am also including an 8-minute GDX chart. As you know, I am not a fan of a leading diagonal. Yet, I do have to outline the potential that GDX can also fill out a leading diagonal should it see a higher high as well. But, until we see that fill in, I have to continually treat this rally as corrective in nature, as I have been outlining for several weeks. But, keep in mind that even if we see a leading diagonal complete, the 2nd wave pullback following a leading diagonal completion is often quite deep. So, I don’t have any expectation that this market is about to break out in the near term. I will be watching NEM quite carefully for signals on this potential, as it is the largest holding within GDX.
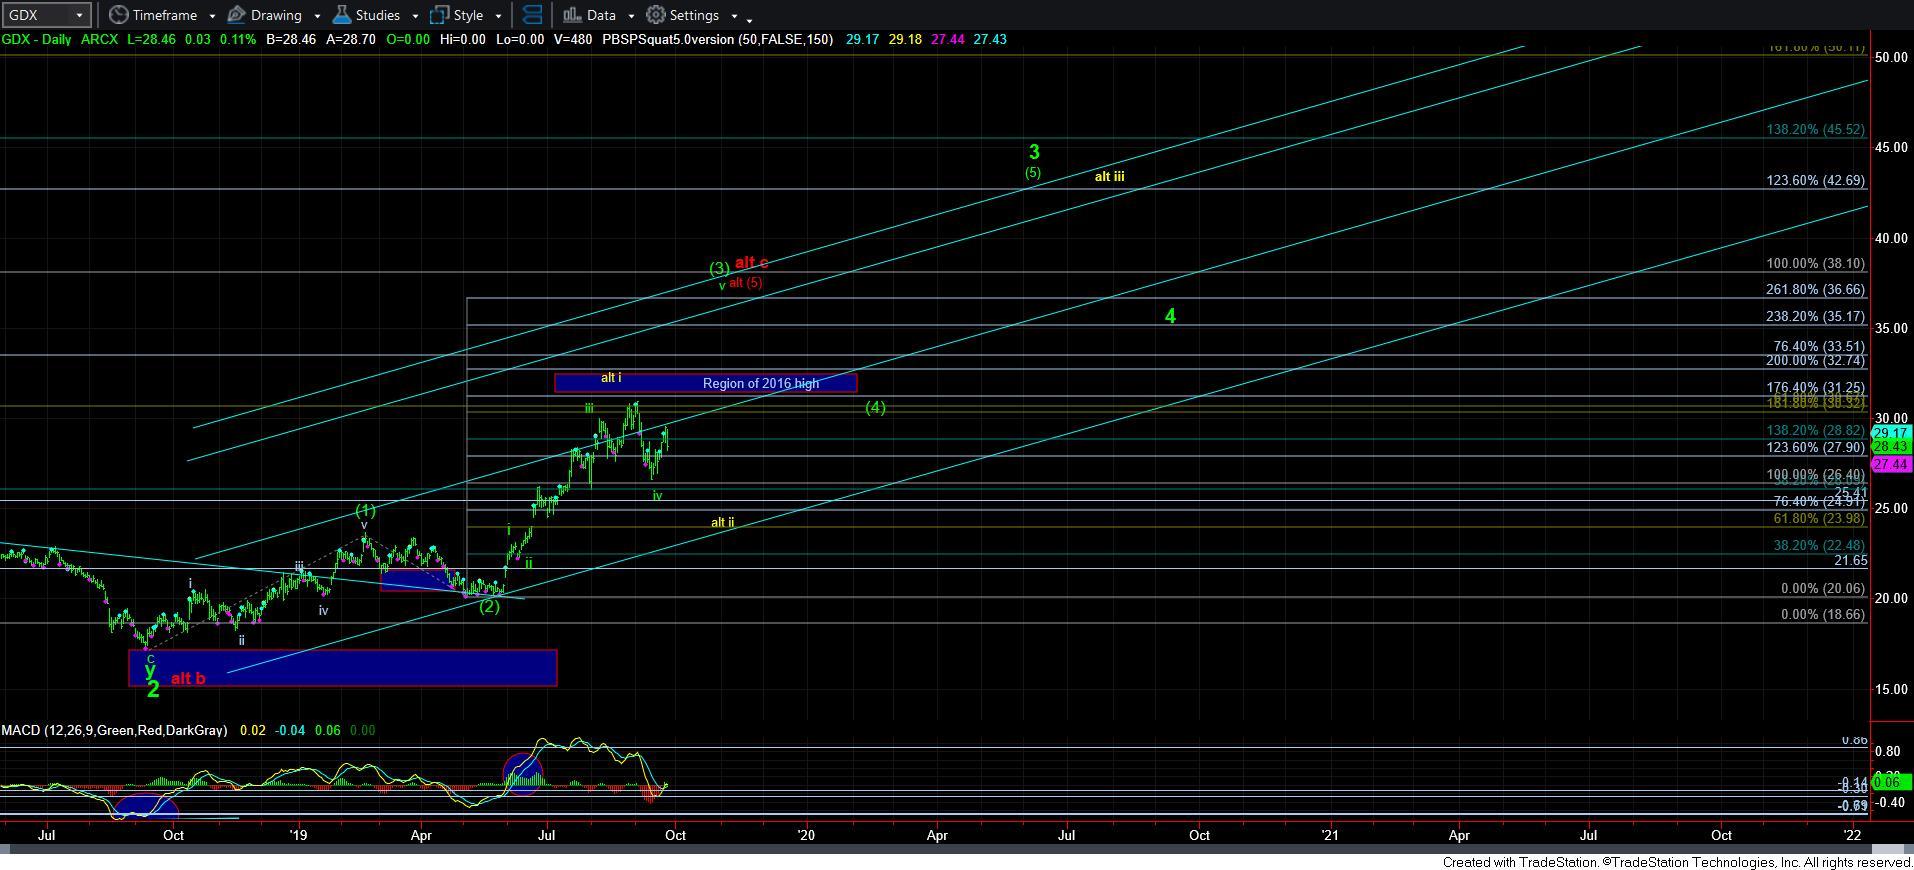
But, interestingly, should we see a much deeper pullback in the yellow count as presented on the daily GDX chart, this would line up quite nicely with a number of other major mining charts that have yet to begin the heart of their 3rd waves just yet.
At the end of the day, I must continue treating this bounce as a corrective structure until it provides indications otherwise, as outlined above. And, even if these charts do provide us with that higher high to provide some indication of a 5-wave structure off the recent lows, a pullback in a 2nd wave will still likely be seen before this market is ready to break out in earnest.