Mercado Libre: Buy And Hold Forever? Not Just Yet.
 By
Levi
By
Levi
- The stock is interesting from a long-term perspective.
- MELI is a good case study in risk management.
- We share key price levels and two main scenarios going forward.
by Levi at StockWaves; produced with Avi Gilburt
“So, what you’re saying is that the stock could either go up or it could go down?”
That is a possible response after one makes a cursory view of one of our articles. But that would be an oversimplification and also misses the point of our methodology.
(MELI) is a good case study in risk management. It also is a wonderful opportunity to showcase the utility and flexibility of our methodology. This is where Fundamentals meet Technicals to provide our members and readers with high-probability setups.
We will share key price levels that will indicate the most probable path forward. Also, note two main scenarios for (MELI) in the near term that will tell us what is most likely for those with a longer time frame view.
Fundamentals are important. They do matter. When they matter and how much is a topic of much debate. We have found how to mesh fundamentals with technicals. Let us show you as we dive into the prospects for (MELI).
Fundamentals with Lyn Alden
Lyn Alden recently provided these comments to our members:
“(MELI) is interesting from a long-term perspective. Latin American e-commerce likely has a long runway for growth ahead, and the 2020s decade is shaping up to be a better environment for emerging markets than the 2010s decade from a macroeconomic perspective.
The valuation has been compressed over the past two years, although the company faces some profitability challenges.”
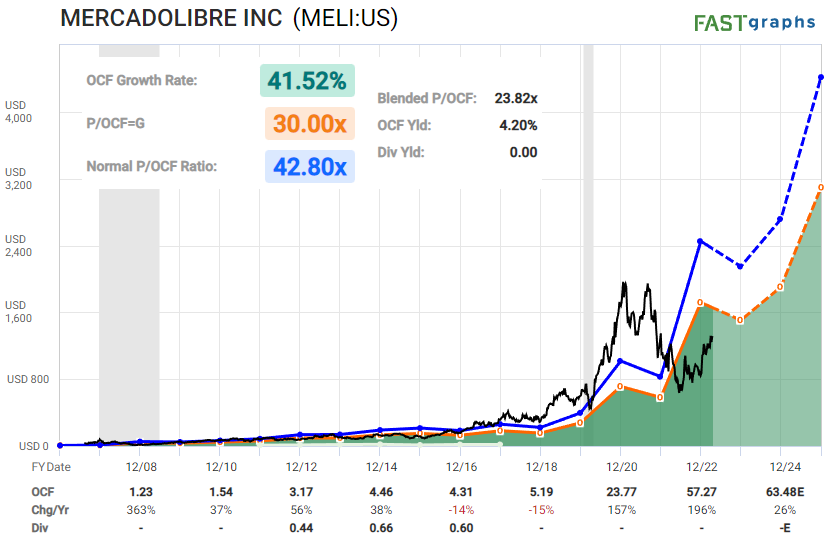
“From a revenue perspective, the stock is cheaper than it has been in recent history with growth is clear. However, higher interest rates sharply lower the baseline multiple for what a company like this is fair to pay for.”
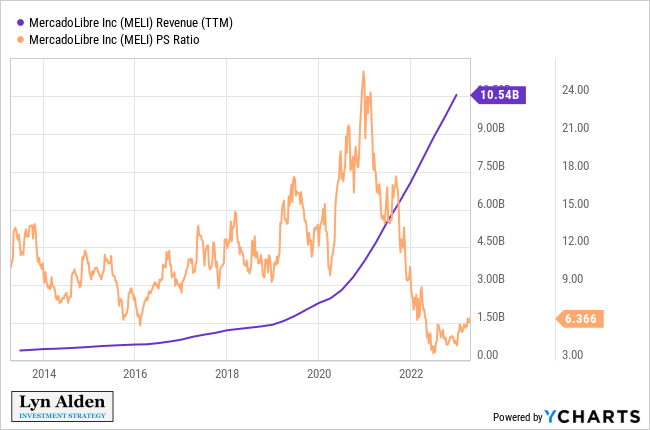
“Overall, it'll be interesting to see if the stock can correct or consolidate for a while. A retrace in price to Zac's targets would make the stock a more compelling buy.”
Now if we could just get price to cooperate with Lyn’s assessment. Zac and Garrett agree that we should see a retrace in the near term. What are the key price levels to watch for and what would tell us the most likely path?
The Technical Viewpoint
Zac Mannes shared this a few days ago:
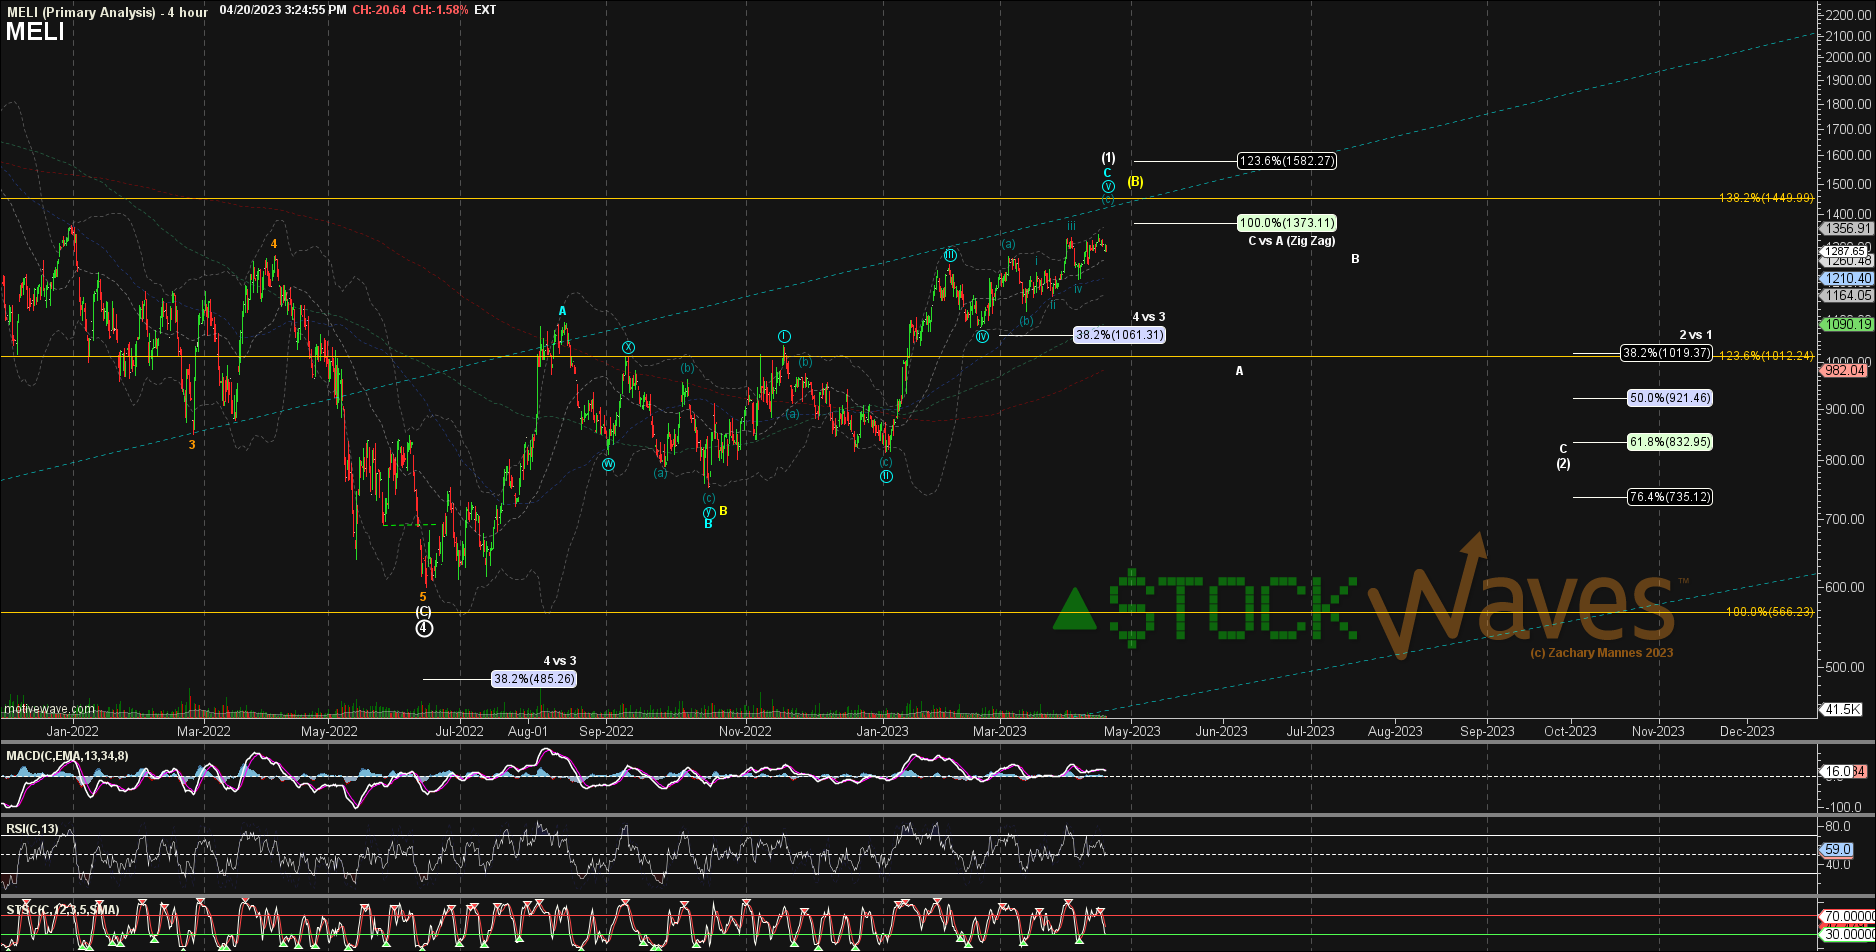
“MELI is a good case study in risk management viz subwave structure in Elliott Wave.
It is filling out an A-B-C up from June as either [1] or [B].
If [1] then it should fade as a [2], and since an Ending Diagonal for Primary 5 it could be pretty wide and deep for that [2] to the 900-800 region.
And IF a [B] then the Primary Wave 4 is not done and a [C] down could head to 400’s...or worse.
So, it’s prudent to play it safe into this 1400 resistance region and look for a CLEAR A-B-C for [2] to hold, even if one is bullish on (MELI) long term for other reasons. Small degree supports at 1255 & 1200 for higher in the v’th of C.
As of right now, (MELI) has a nominal high over the ‘iii’ inside [c] of circle ‘v’. It can easily count as complete in the A-B-C up as either [1] or yellow [B].”
♦︎ For those new to Elliott Wave, it will almost seem like a foreign language. You may say:
“Yes, I recognize the letters and numbers as belonging to the English language, but it just looks like a bunch of mumbo-jumbo”.
Zac has an amazing talent of identifying risk and key turning points in the structure of price. It’s not mumbo-jumbo, you’re simply watching a master craftsman illustrate his work.
If we were to ‘translate’ this to a very basic premise, it would be that the 1400 area is key resistance. Can (MELI) break directly above this level? The answer to, “Is this possible…?” will always be “yes”. But, remember that we view the market from a probabilistic standpoint.
We identify the most probable path based on the current structure of price. We will also trace out a potential alternative path as a back-up plan. This prepares us for just about whatever the market will generate and allows us to adapt in rapid fashion.
For (MELI) the structure of this next pullback is key.
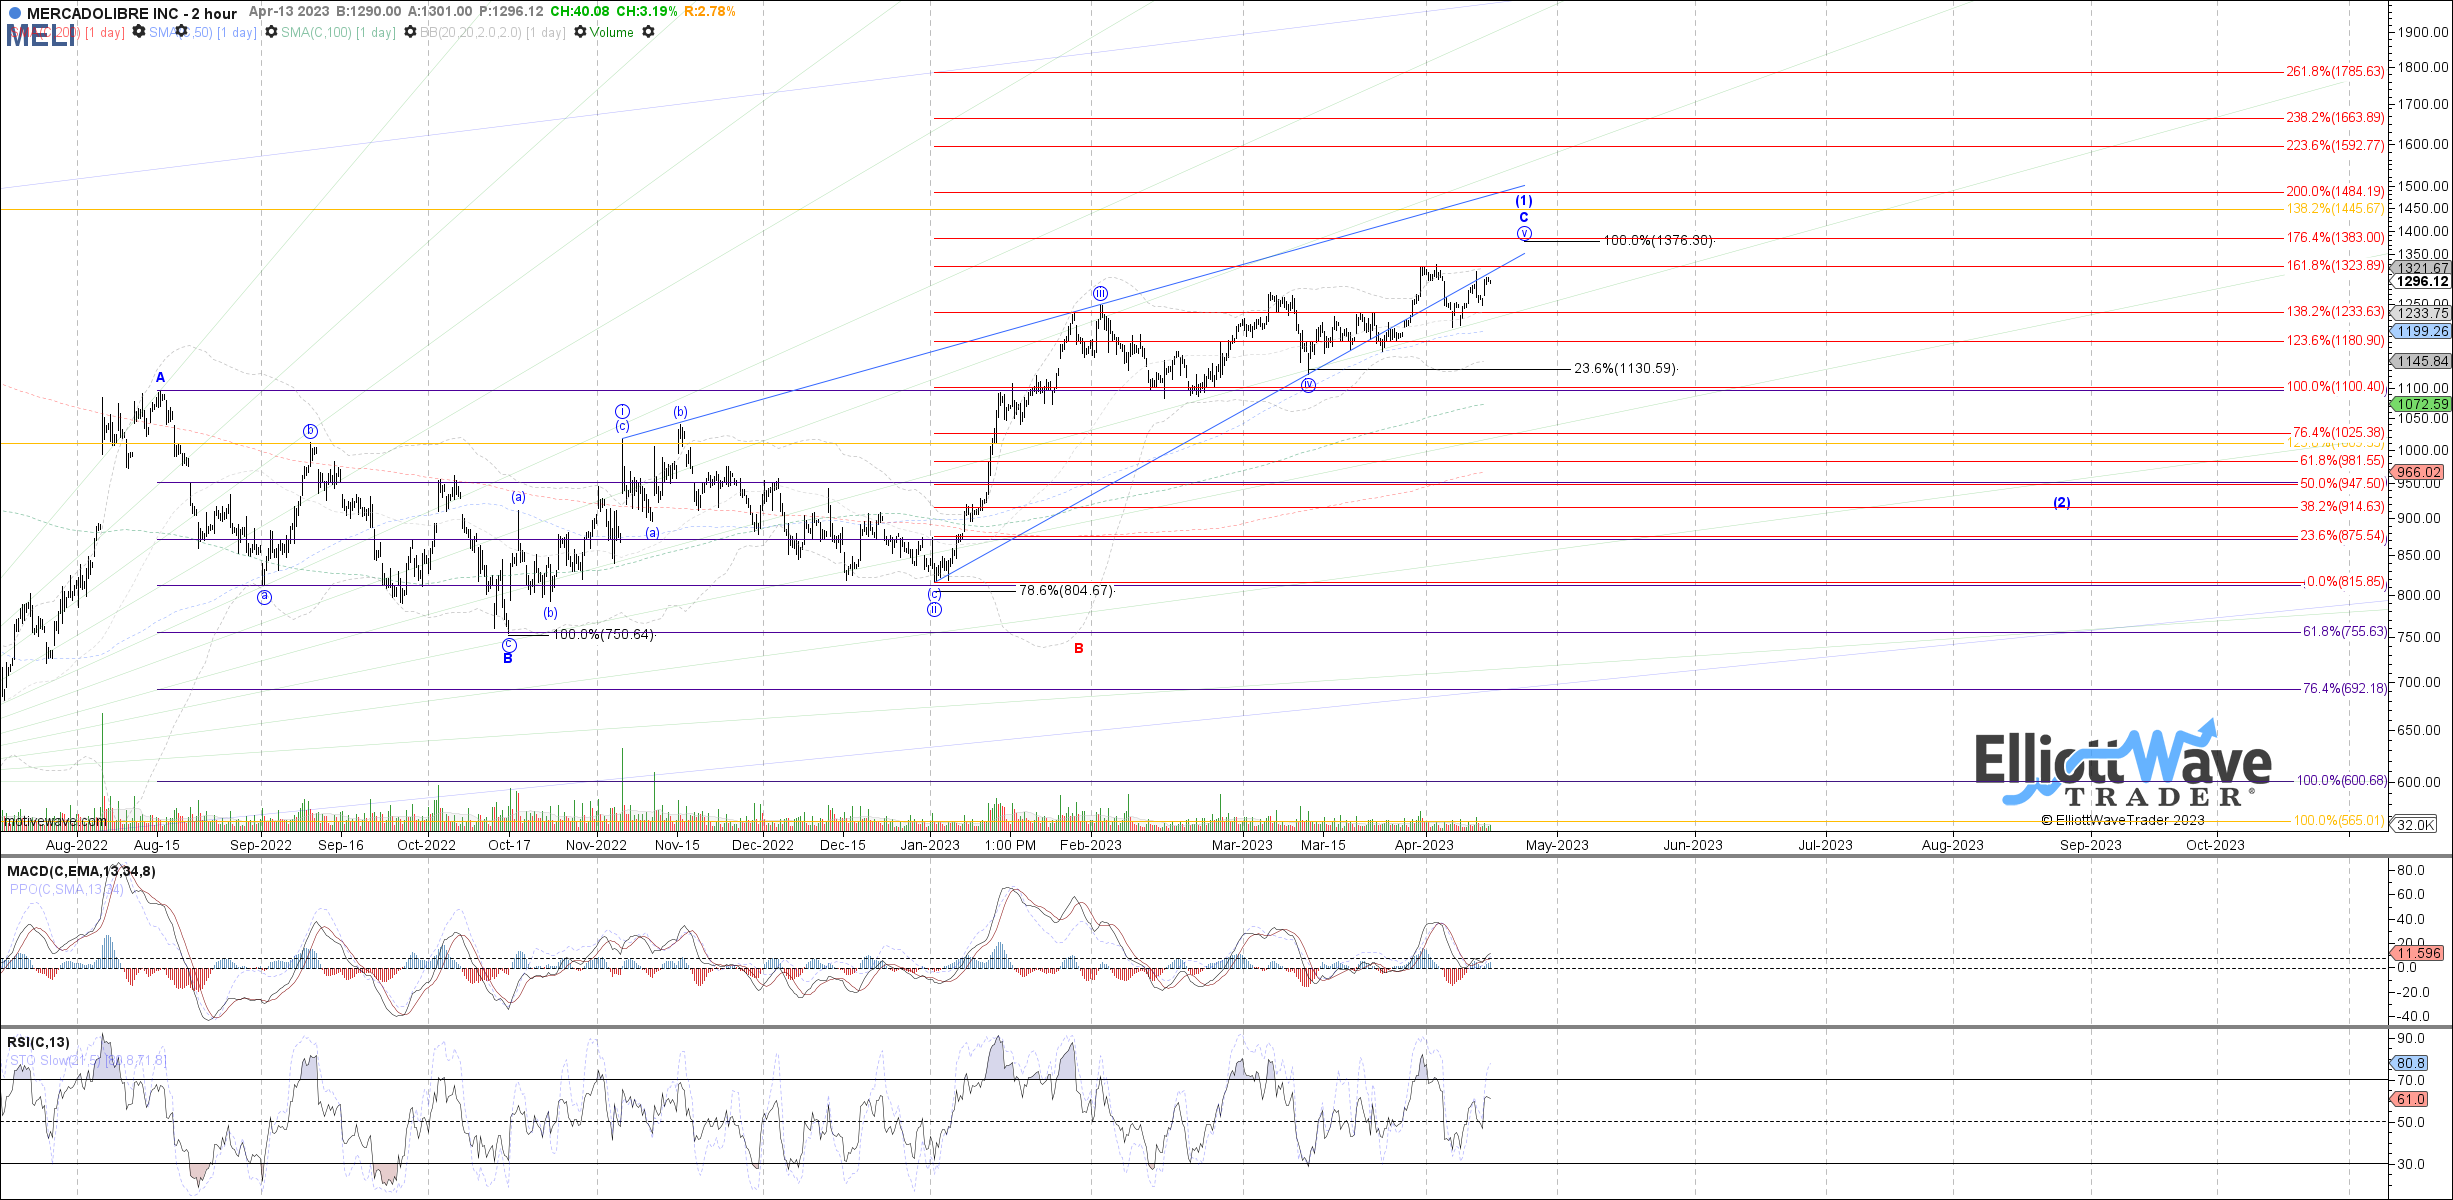
Note Garrett’s chart as well that is in-synch with Zac’s view:
Risks
The greatest risk we see here is if our assumption of a near term pullback is not met. (MELI) could plausibly continue directly higher. However, as stated in our viewpoint above, this is not our primary scenario.
Another potential risk is that (MELI) actually sees a more protracted and deeper pullback. We will continuously update the chart for our members based on how the structure of price fills out in the coming days.
Why A Probabilistic Viewpoint?
We want everyone reading these articles to understand that markets are fluid, dynamic, non-linear systems. In order to trade such systems, one has to develop the experience necessary to navigate its complexities.
So, how do we turn what appears to be random into an advantage? Elliott Wave has as it foundation the repeating fractal nature of financial markets. This means that there are structures that continue to form on all time frames and it is the repetition of them that gives us an edge.
What is this framework of this structure? Please allow me to share an excerpt from the article: “This Analysis Will Change The Way You Invest Forever - Part 3”, which you can read in its entirety here. It is part 3 of a 6-part series published by Avi Gilburt here on Seeking Alpha. It is well worth your time to read the series.
The article discusses what ‘Phi’ is and how it is ever more present in our lives than we may be aware.
“Further examples include the fact that the naval in the human body divides the average adult body into Phi-based proportions, the neck divides the distance from the naval to the head into a Phi-based proportion, the heart muscles in the left ventricle are made up of a series of spirals that repeatedly contract to a point that is approximately .618 of the long axes from the aortic valve to the apex, and so on.
In fact, Leonardo da Vinci depicted the general external Fibonacci relationships within the body of man in one of his most popular drawings entitled ‘Vitruvian Man’.”

What does a 500 year old sketch have to do with the stock market?
Here is one more excerpt from that article:
“There is significant evidence that behavior and decision making within a herd and on an individual basis displays mathematically driven distributions based on Phi.
This basically means that mass decision making will move forward and move backward based upon mathematical relationships within their movements. This is the same mathematical basis with which nature is governed. The same laws that were set in place for nature also govern man’s decision making en masse, and on an individual basis.”
Let Leonardo Provide Guidance
Not da Vinci though. This is Leonardo Pisano Bigollo, or more commonly known as Leonardo Fibonacci. If you would like to read more about this history and work, please review the above referenced article.
Here’s The Key Takeaway For MELI
We anticipate resistance to hold at the 1400 level. Watch carefully how the next pullback unfolds. If (MELI) is to realize its longer term potential then we should see a move down to the 900 region which could provide an attractive entry point.
Some Important Things To Remember
I would like to take this opportunity to remind you that we provide our perspective by ranking probabilistic market movements based upon the structure of the market price action. And if we maintain a certain primary perspective as to how the market will move next, and the market breaks that pattern, it clearly tells us that we were wrong in our initial assessment. But here's the most important part of the analysis: We also provide you with an alternative perspective at the same time we provide you with our primary expectation, and let you know when to adopt that alternative perspective before it happens.
There are many ways to analyze and track stocks and the market they form. Some are more consistent than others. For us, this method has proved the most reliable and keeps us on the right side of the trade much more often than not. Nothing is perfect in this world, but for those looking to open their eyes to a new universe of trading and investing, why not consider studying this further? It may just be one of the most illuminating projects you undertake.
