Melt-Up Phase May Take A Few More Weeks Before It Is Triggered In Some Charts
Thus far, the metals are making nice progress, as they continue to fill out their bullish set ups. Yet, the moment we are all awaiting is when they trigger into the heart of a 3rd wave. And, we are certainly getting closer. So, let’s look at what we need to see for that to happen.
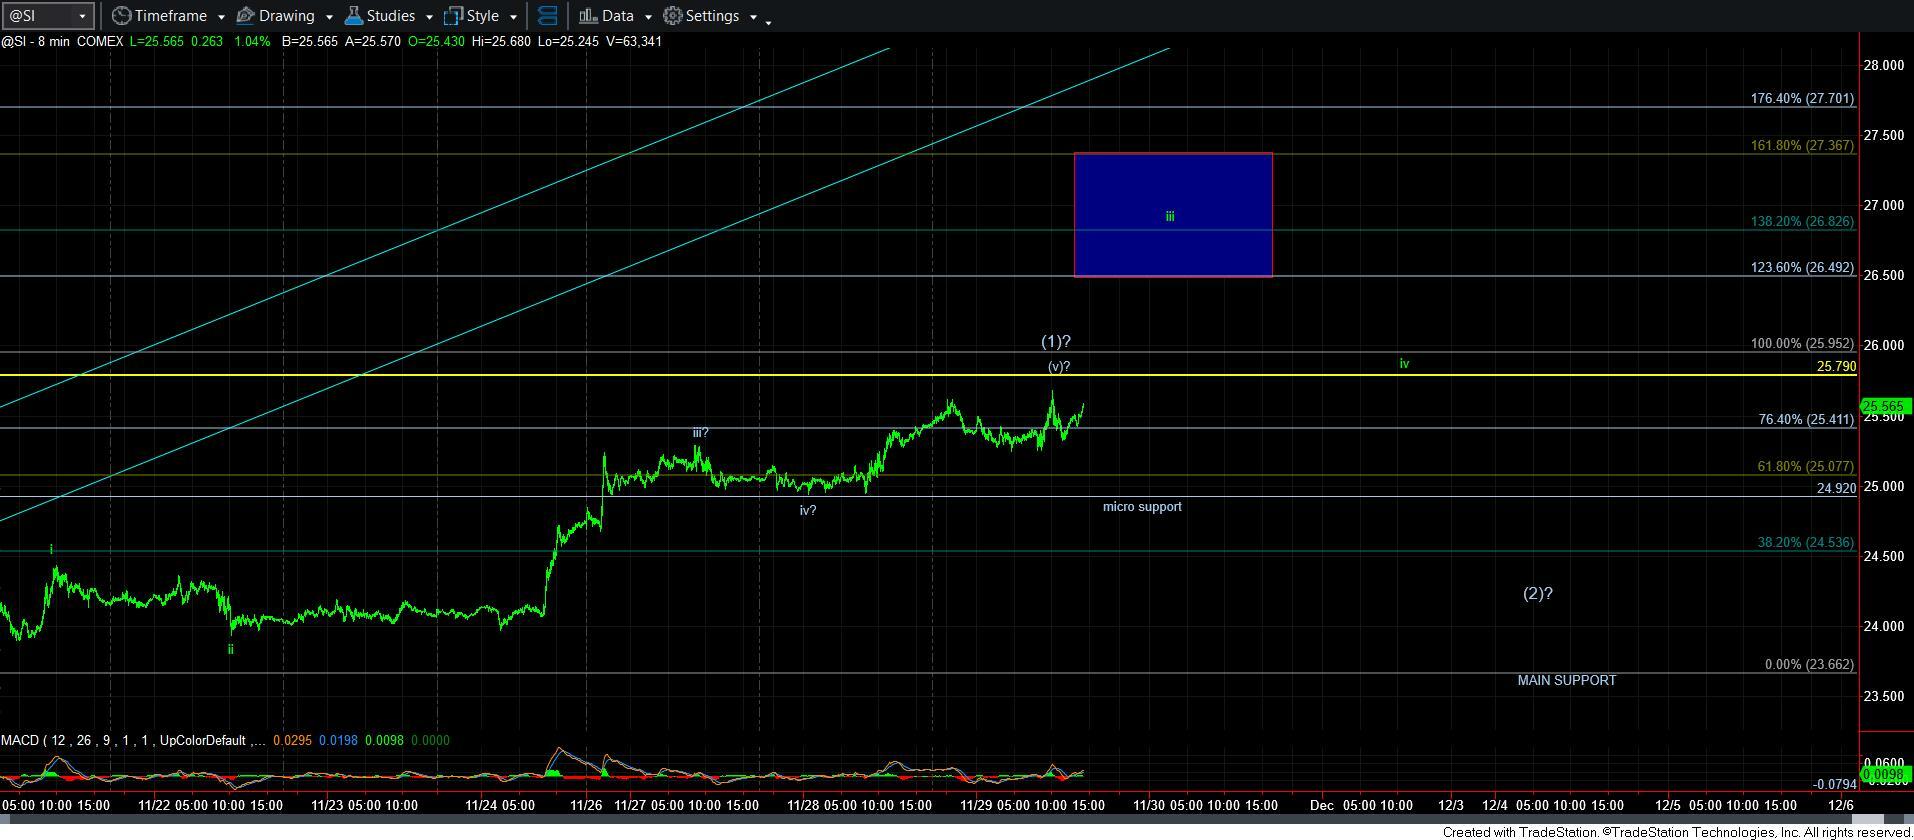
Starting with silver, oddly enough, we still have not cleared the top of wave 2, as presented by the yellow line on the silver charts. Clearly, this still much be done in order to invalidate the yellow count completely. Yet, I can say that the probability of the yellow count at this time seems quite low.
Moreover, the current micro structure, as presented on the 8-minute silver chart suggests that we may have one more [1][2] structure developing (of which we are now completing wave [1]), which means that we still can see another corrective pullback in wave [2] before we break out over the high of the yellow wave 2 in the 25.79 region. (Please note that my charts have now been moved to the March 2024 contract).
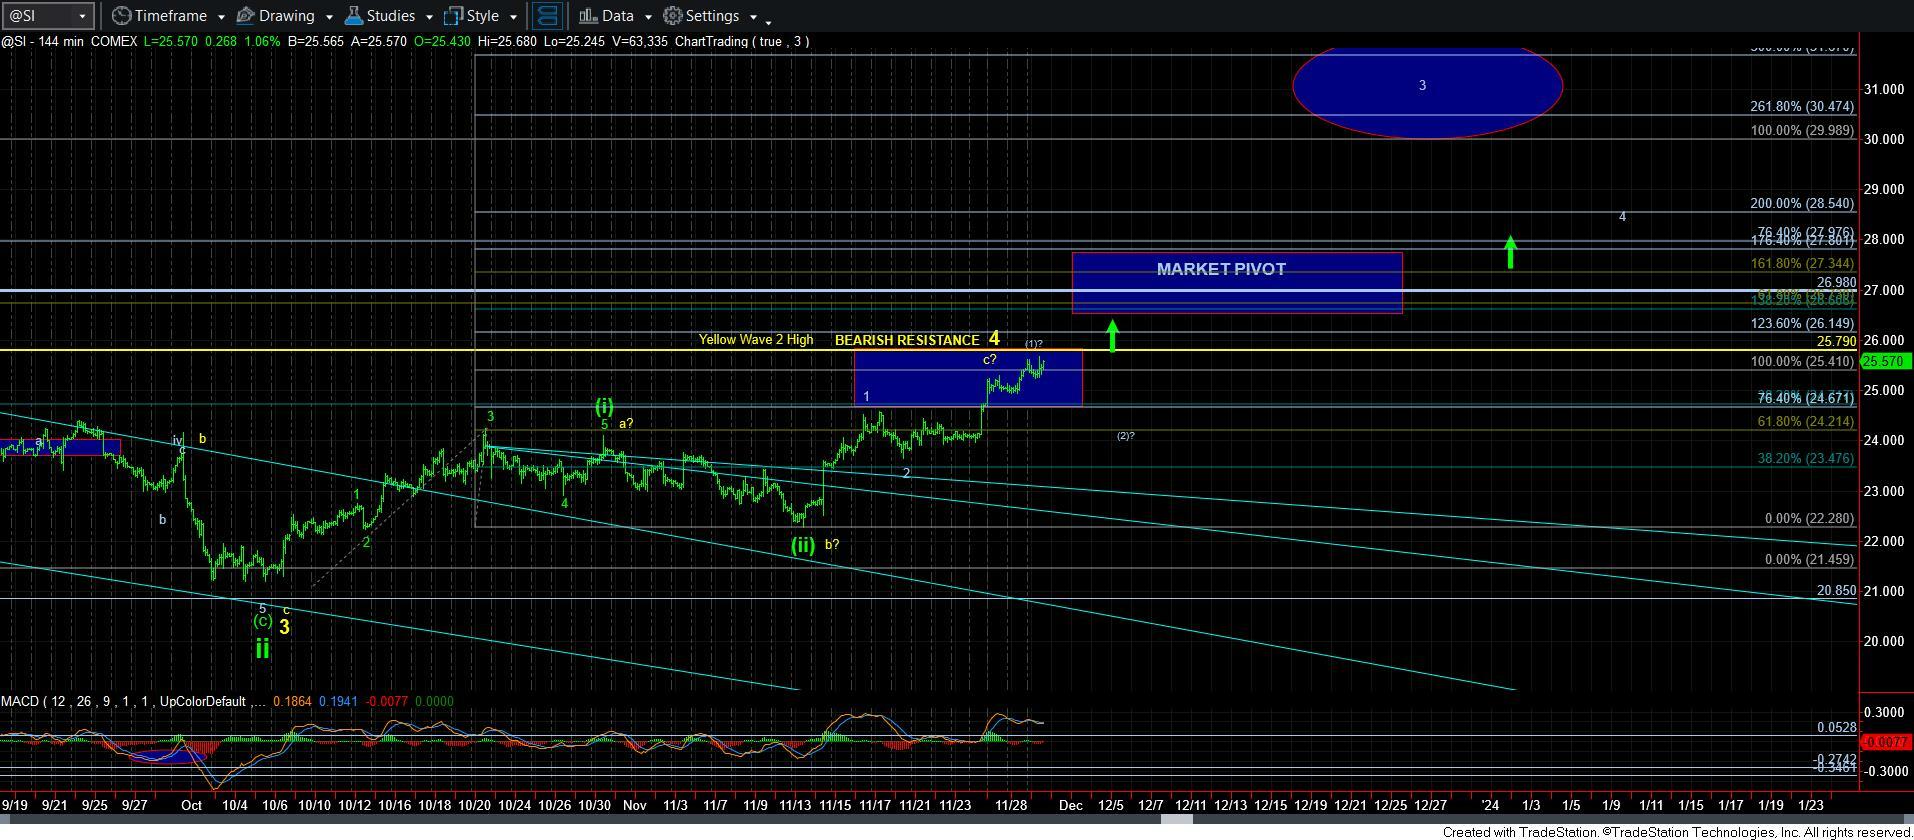
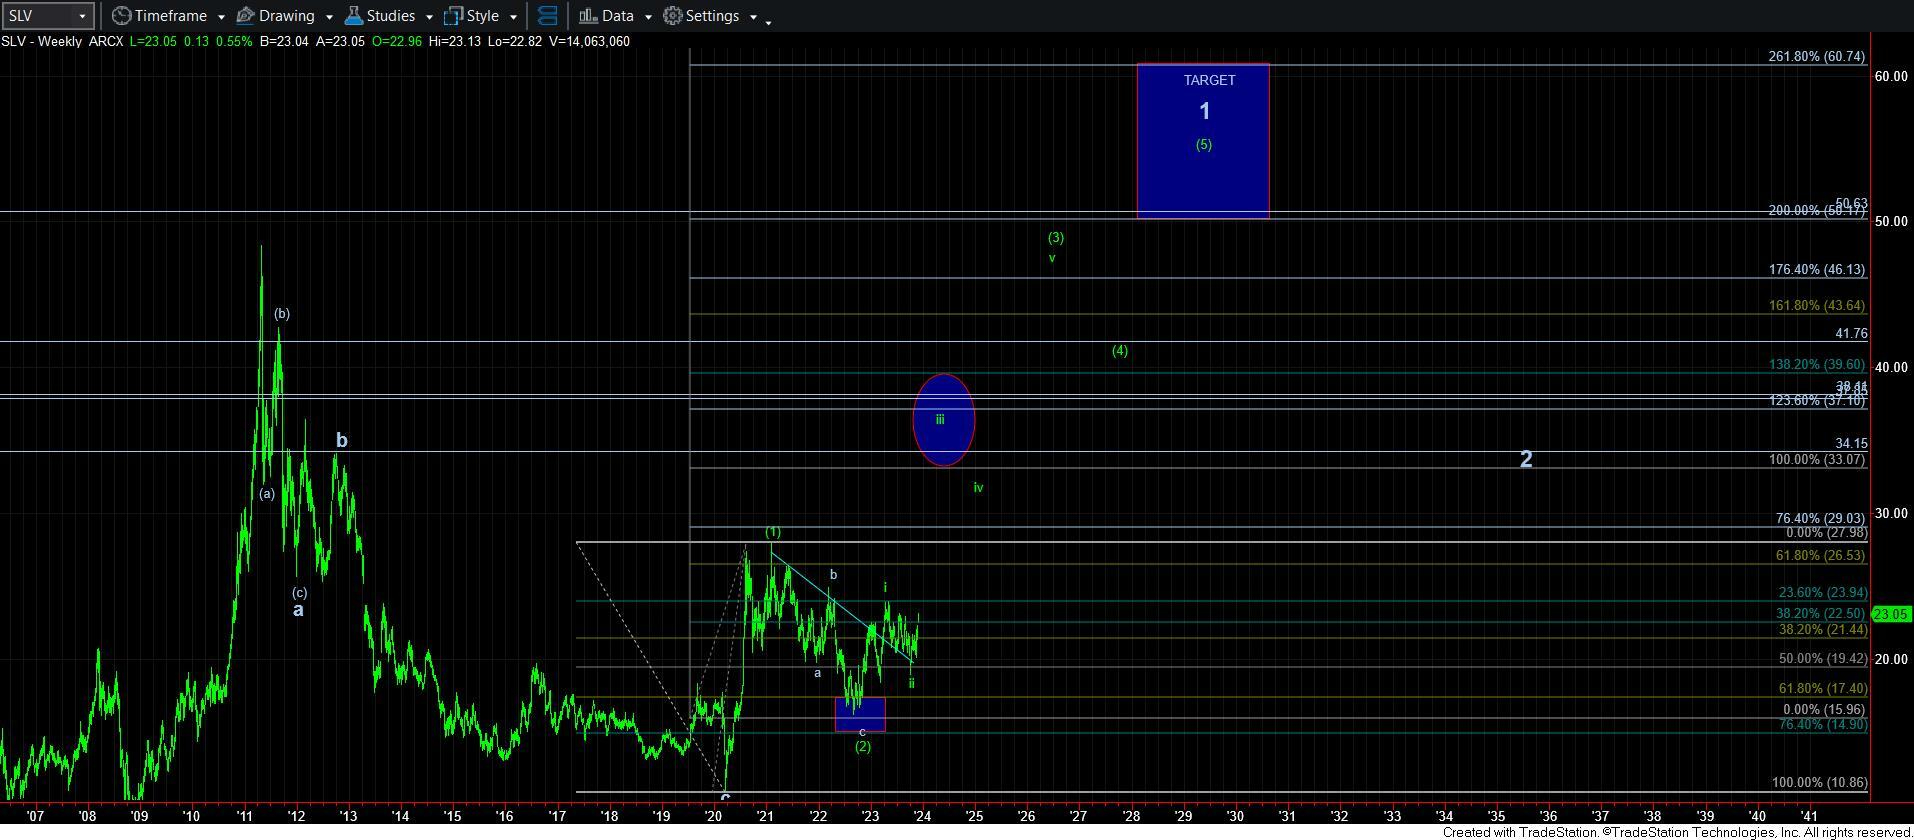
Once that [1][2] completes, and we rally through the high of wave [1], then we will likely be starting the heart of the 3rd wave, which should carry us through most of 2024. And, wave 3 of [iii] of iii of [3] alone will likely carry us to the 29-32 region, as you can see on the 144-minute chart. For a bigger timeframe picture, you can see the attached SLV weekly chart. Is should be rather clear from that chart that once we break out in wave 3, it is only the start of the larger degree wave [3], which, again, should carry us through 2024. And, while I have it spaced out further on the SLV weekly chart, I would not at all be shocked that it becomes quite compressed, such as that which was seen in 2010-2011 in the silver market.
Now, that being said, should the market provide us with a more immediate break out through 25.80, and take us into the blue box noted overhead on the 8-minute chart, then it is clear that the silver 3rd wave have indeed begun, and we will be seeing many spikes higher, followed by ever increasing higher degrees of 4th wave consolidation, with the first one being wave iv of 3, as shown by the green count on the 8-minute chart, with wave v of 3 pointing us to the 29-32 region.
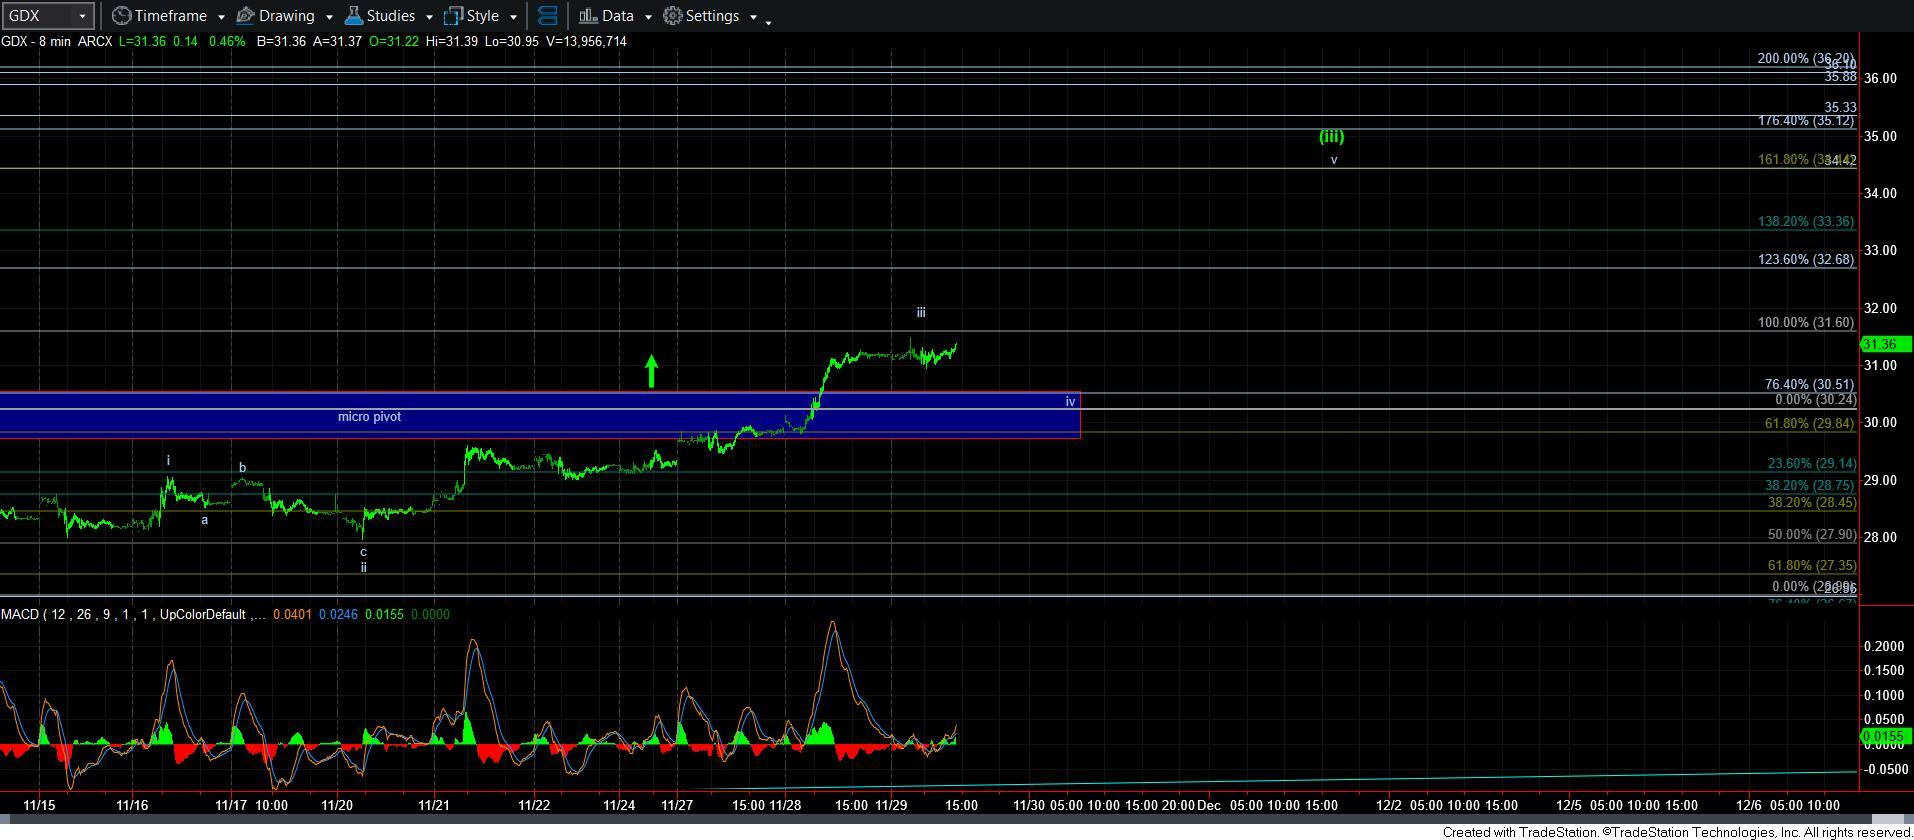
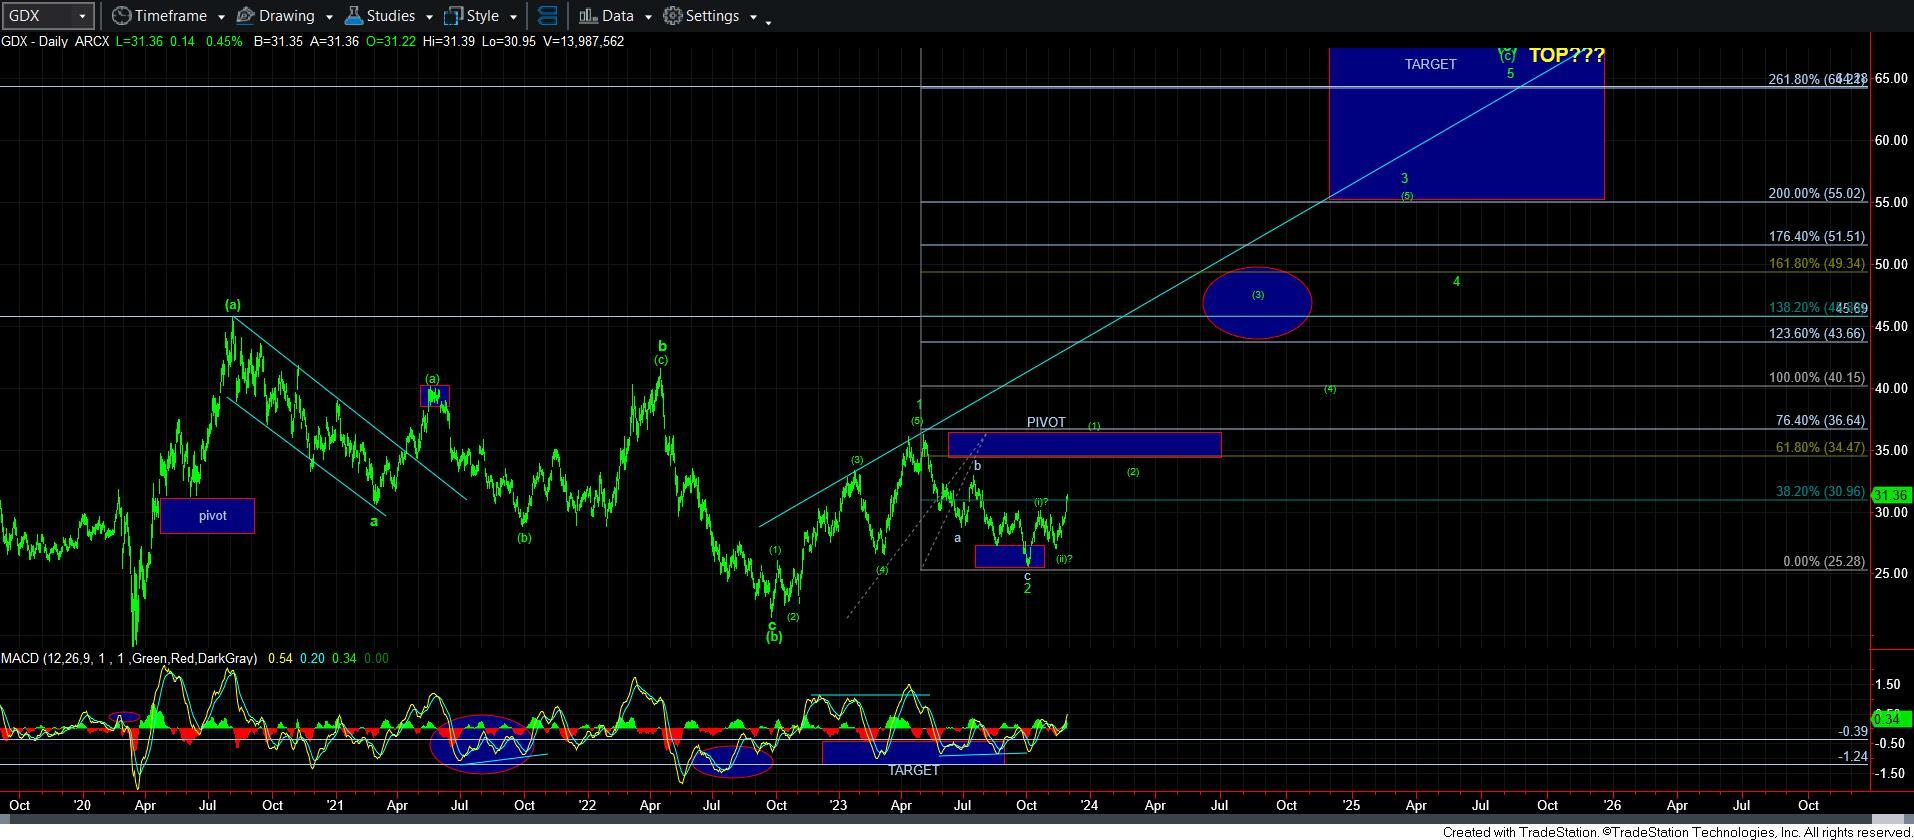
This now brings me to the GDX. We have now broken out through the micro pivot on the 8-minute chart. And, to be honest, if we are indeed ready to see a major move in GDX, then we should not be breaking down below that pivot at any point in time going forward, even in the wave [2] down the road. Ideally, we are now on our way to the 36 region for wave [1], as you can see on the daily chart.
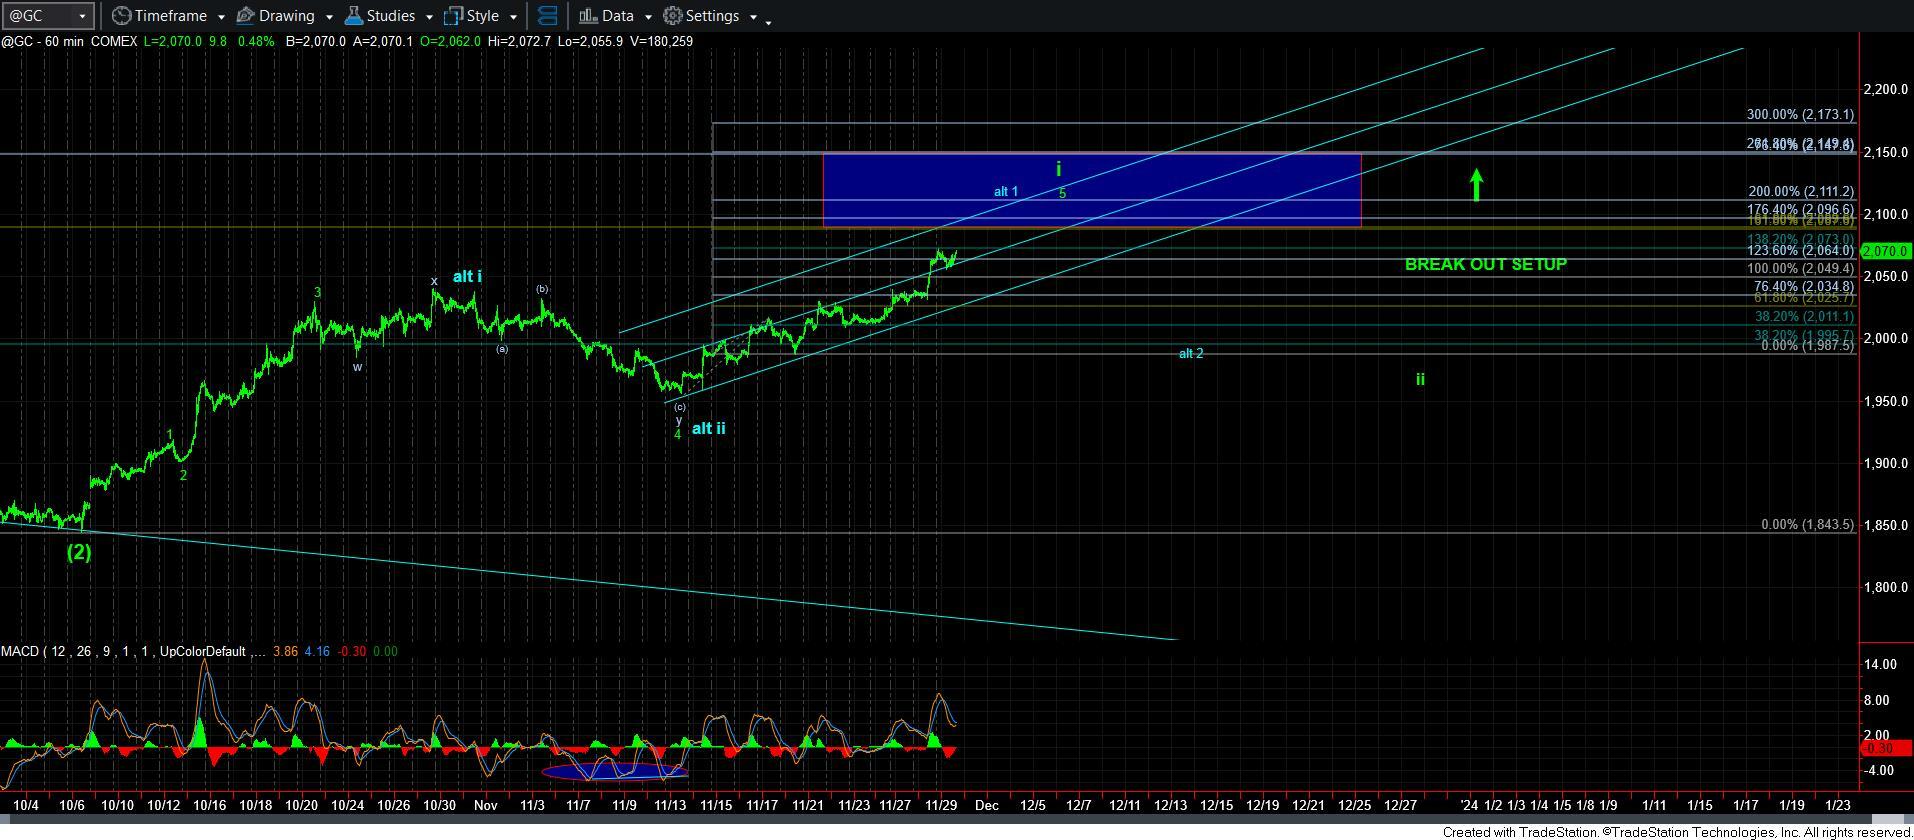
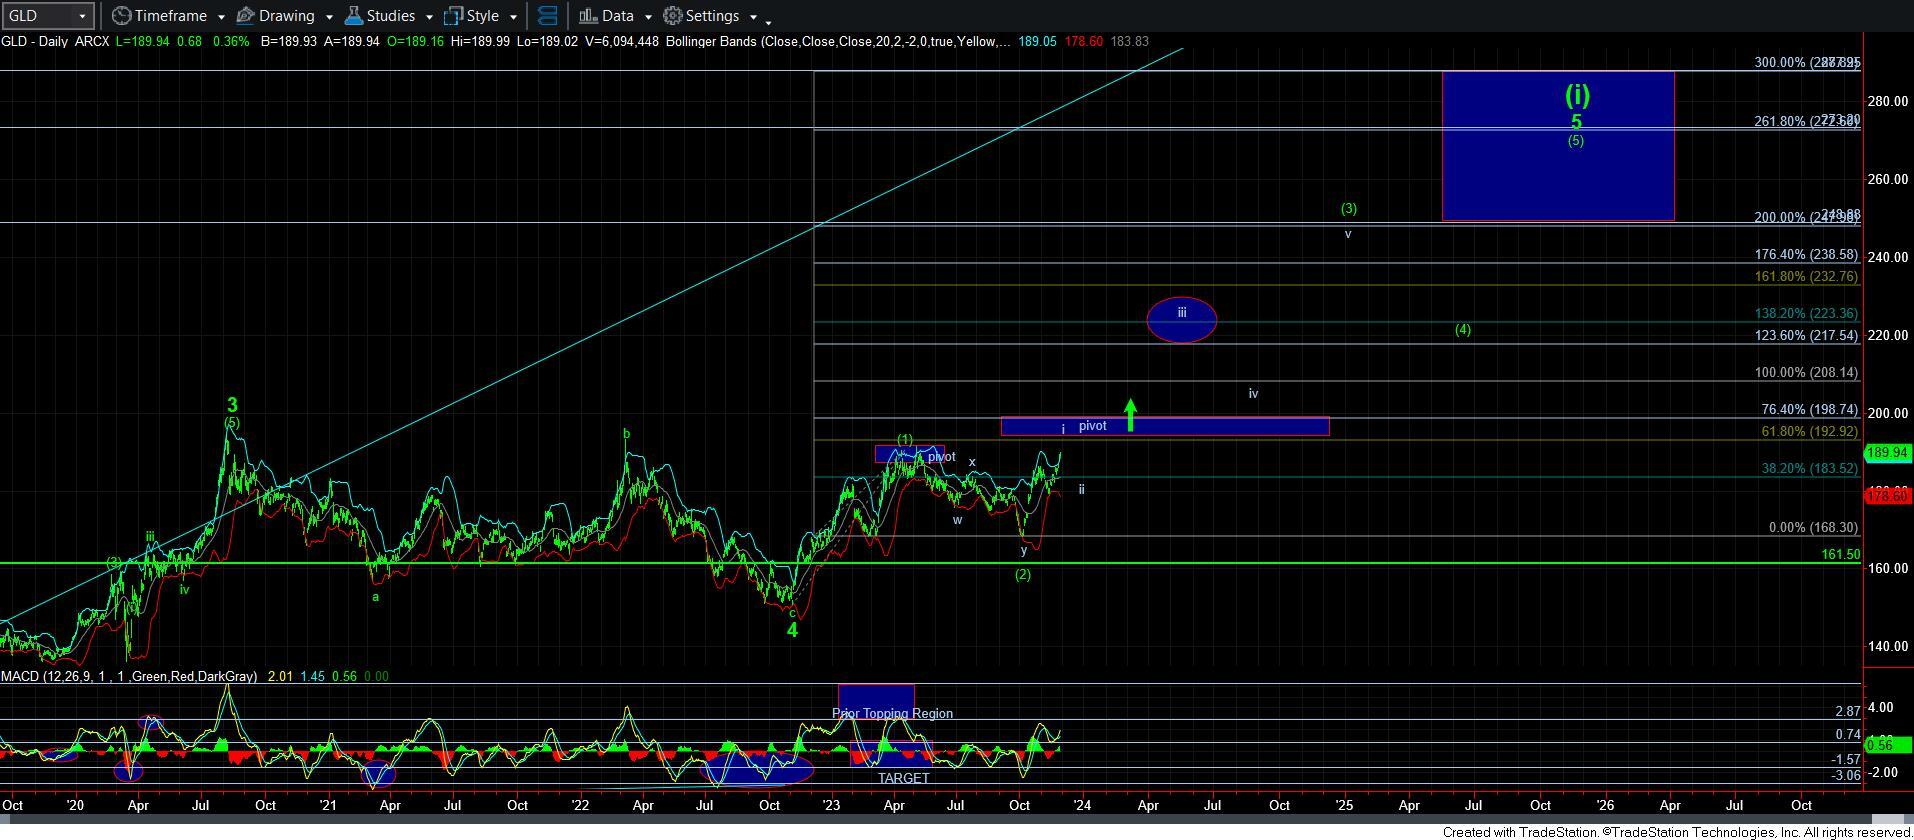
Gold now has a really nice 5-wave rally structure off the October low. This can be most clearly seen on the daily GLD chart attached, and both the GC and GLD charts label this move as wave i of wave [3]. That means we can see a wave ii pullback take us through December, with the heart of wave iii of [3] potentially starting in the early part of 2024.
Now, there is some potential that we may be in a more accelerated i-ii, 1-2 structure, which would suggest wave 3 of iii [3] is starting a bit sooner than expected, and that is highlighted on the 60-minute GC chart as the alt i-ii, alt 1-2. Clearly, when this rally completes, and we see a corrective retrace, the next time we take out the high of this current rally segment will signal that the 3rd wave has begun in earnest. Until that time, we MAY see a bit more of a pullback in December for wave ii.
Overall, the metals market is finally progressing nicely. And, while we may be on the cusp of a heart of a 3rd wave taking hold, there are still just a few more steps to be seen before all three of these charts are confirmed in that count. But, keep in mind that they may not all get there at the same time, as I would not be shocked to see silver lead in this endeavor.

