May Closed At Dead Highs As Expected, Continued Bullishness Into June
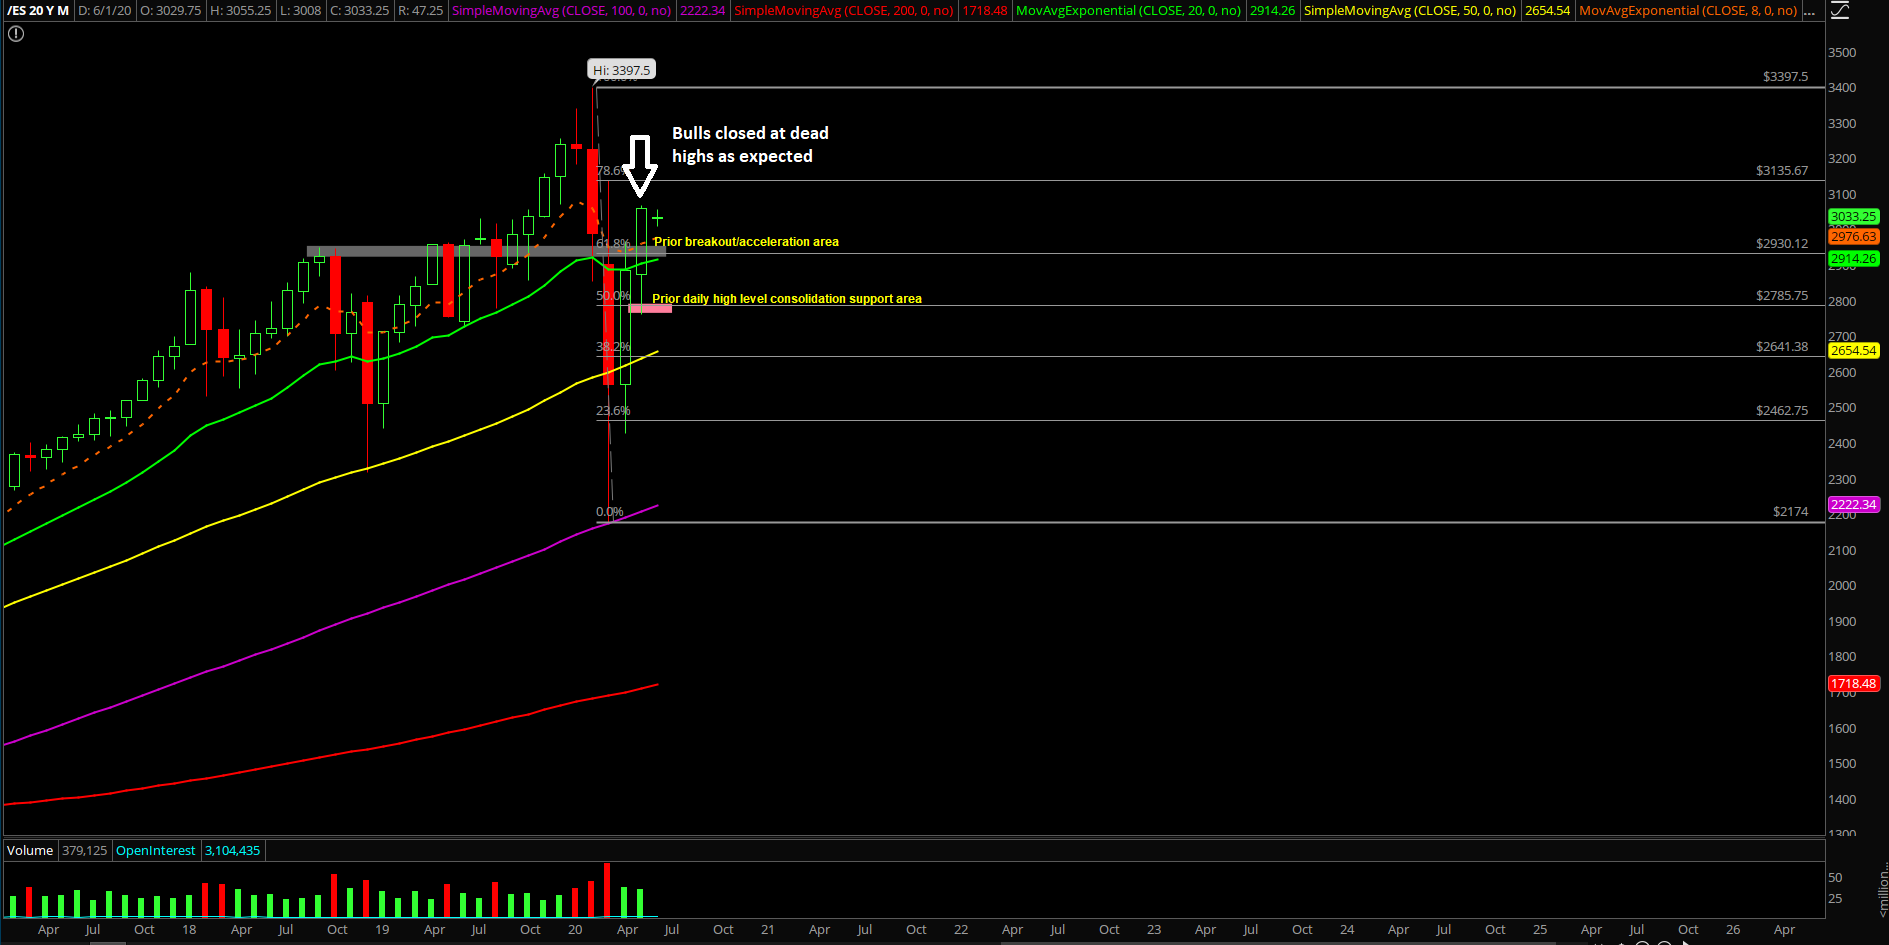
The final week of May played out as expected by closing at the monthly dead highs if you’ve been following us as the price action has been doing the same thing for the past few weeks/months. Breakout higher, form a range/high level consolidation/bull flag, eventually breakout higher. Rinse and repeat until easy money stops printing or until the strategy does not keep us on the winning side.
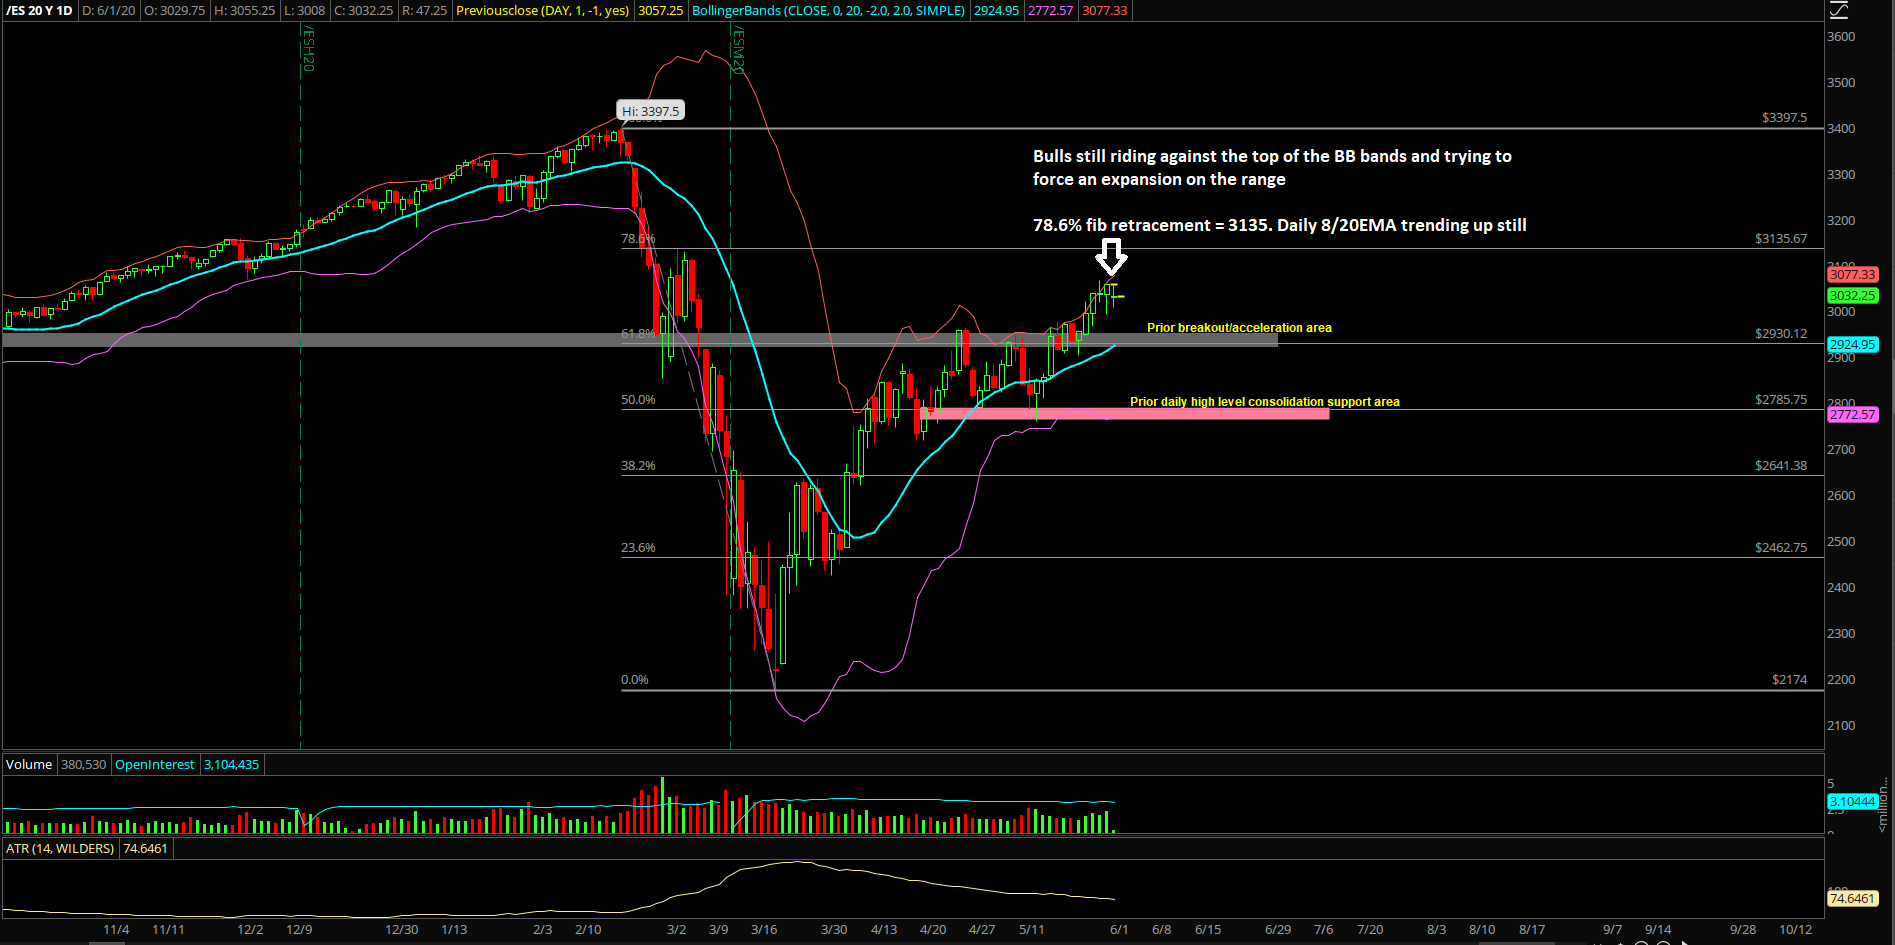
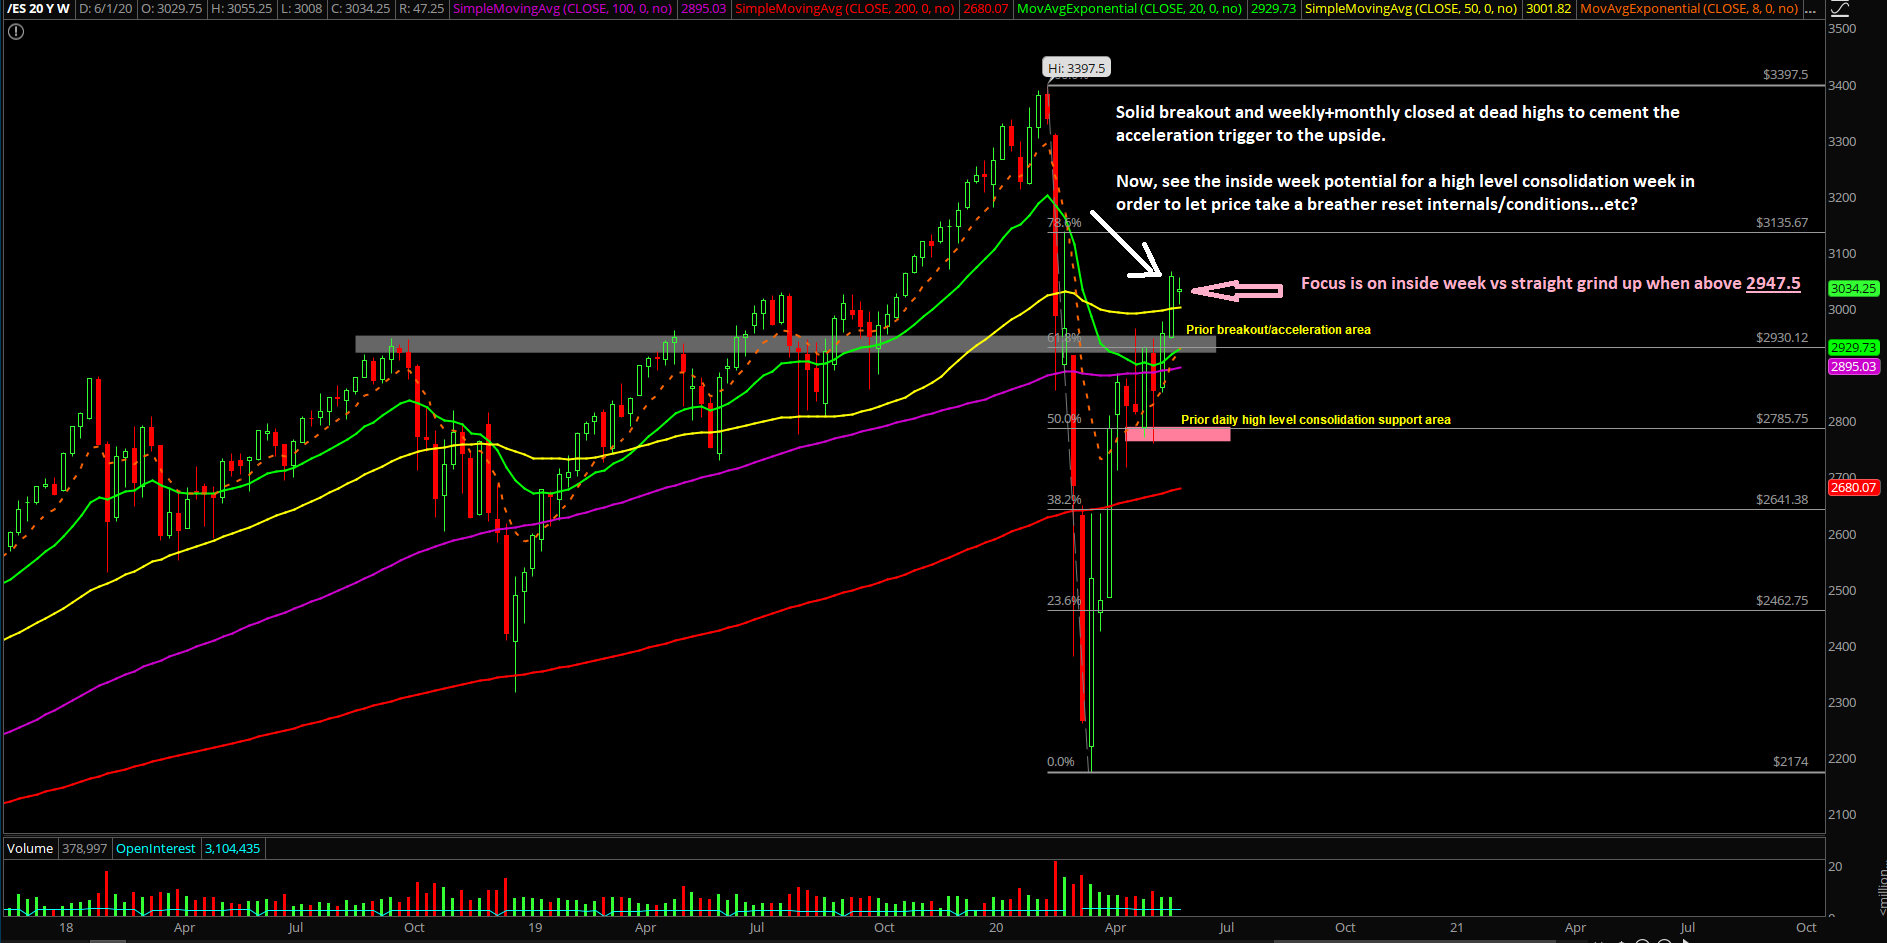
The main takeaway is that the bulls accomplished their key goal by ending the May monthly closing print at the dead highs in order to enhance the odds for upside momentum. The bulls did what they had set out to do since April because it’s been an on-trend upside breakout back to the 61.8-78.6% fib retracement of the entire drop (3397.5-2174 range on the Emini S&P 500). As discussed, the bears ran out of time as they failed to capitalize on all breakdown setups and the bull train has been on an accelerated phase riding the daily 8EMA upside alongside with price action hovering above the 200 day moving average.
What’s next?
The month of May closed at 3057.25 dead highs on the ES, which was the month’s highs area as anticipated by train/trend followers. The price action is crystal clear for this week: inside week then up or just keep grinding up slowly when above our pre-determined key support levels. One side is winning and until price action proves us wrong, then it’s just the same old strategy. Repeat of year 2019 for now, higher lows and higher highs. Take profit, rinse and repeat until the train wheels fall off.
Summarizing our game plan:
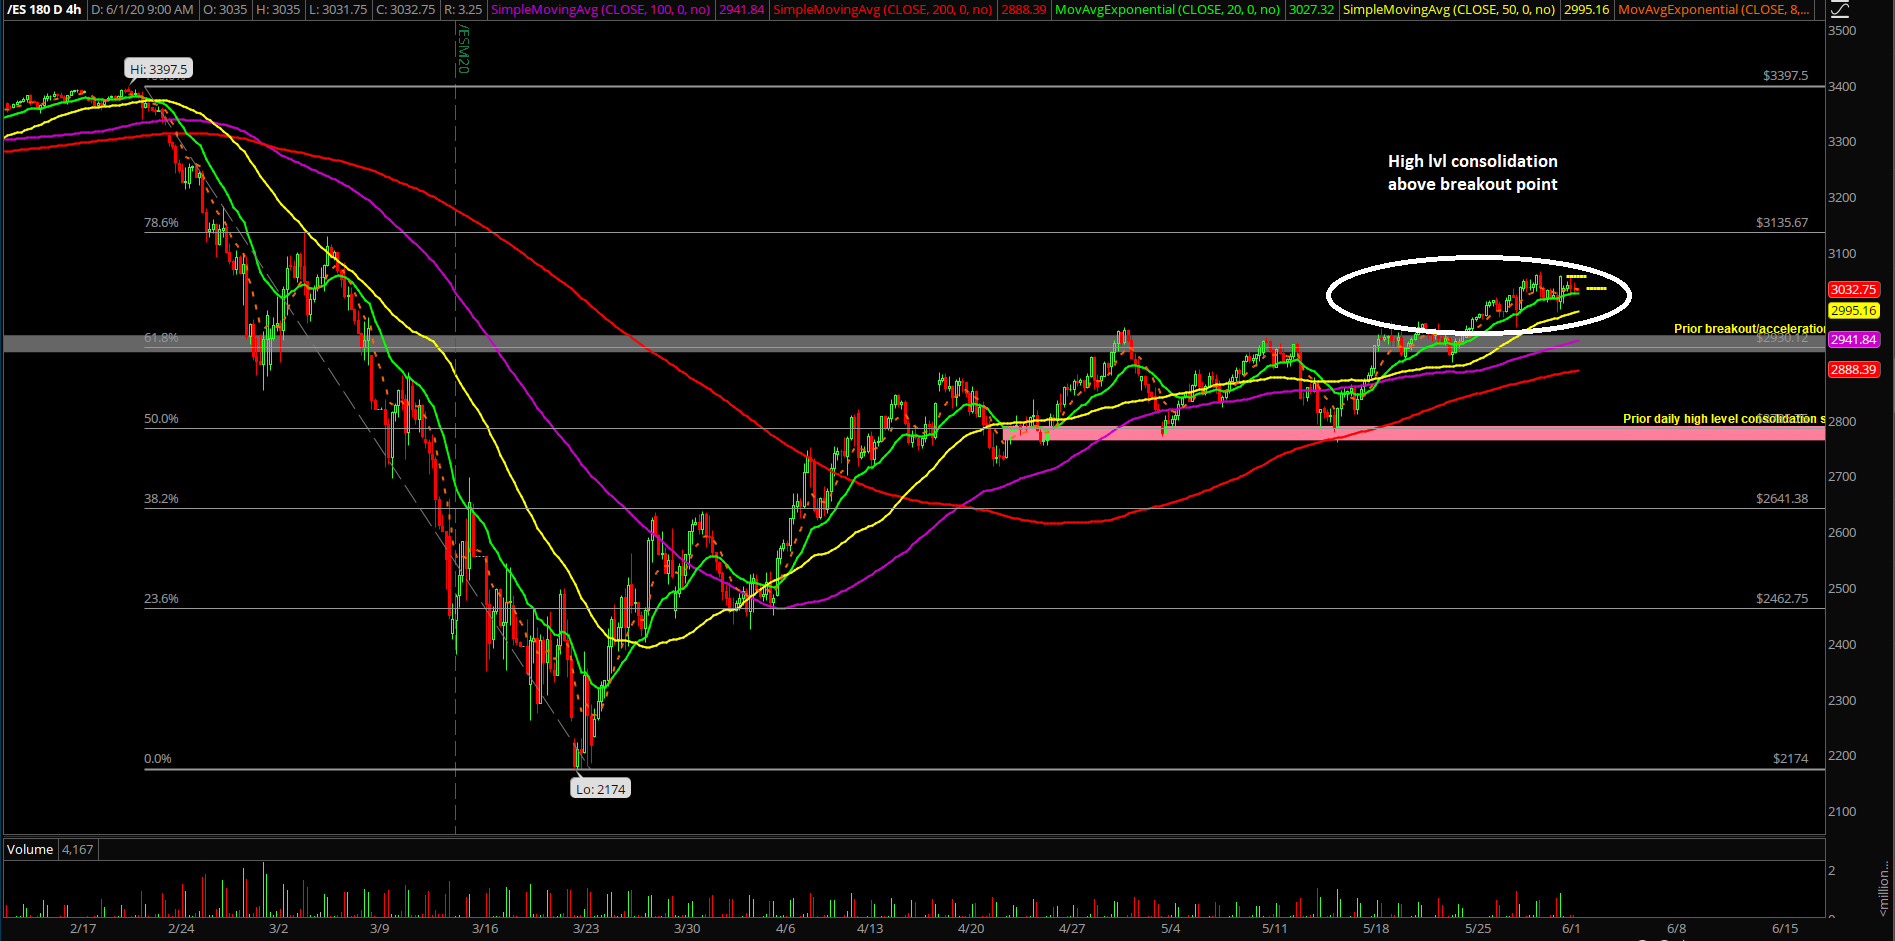
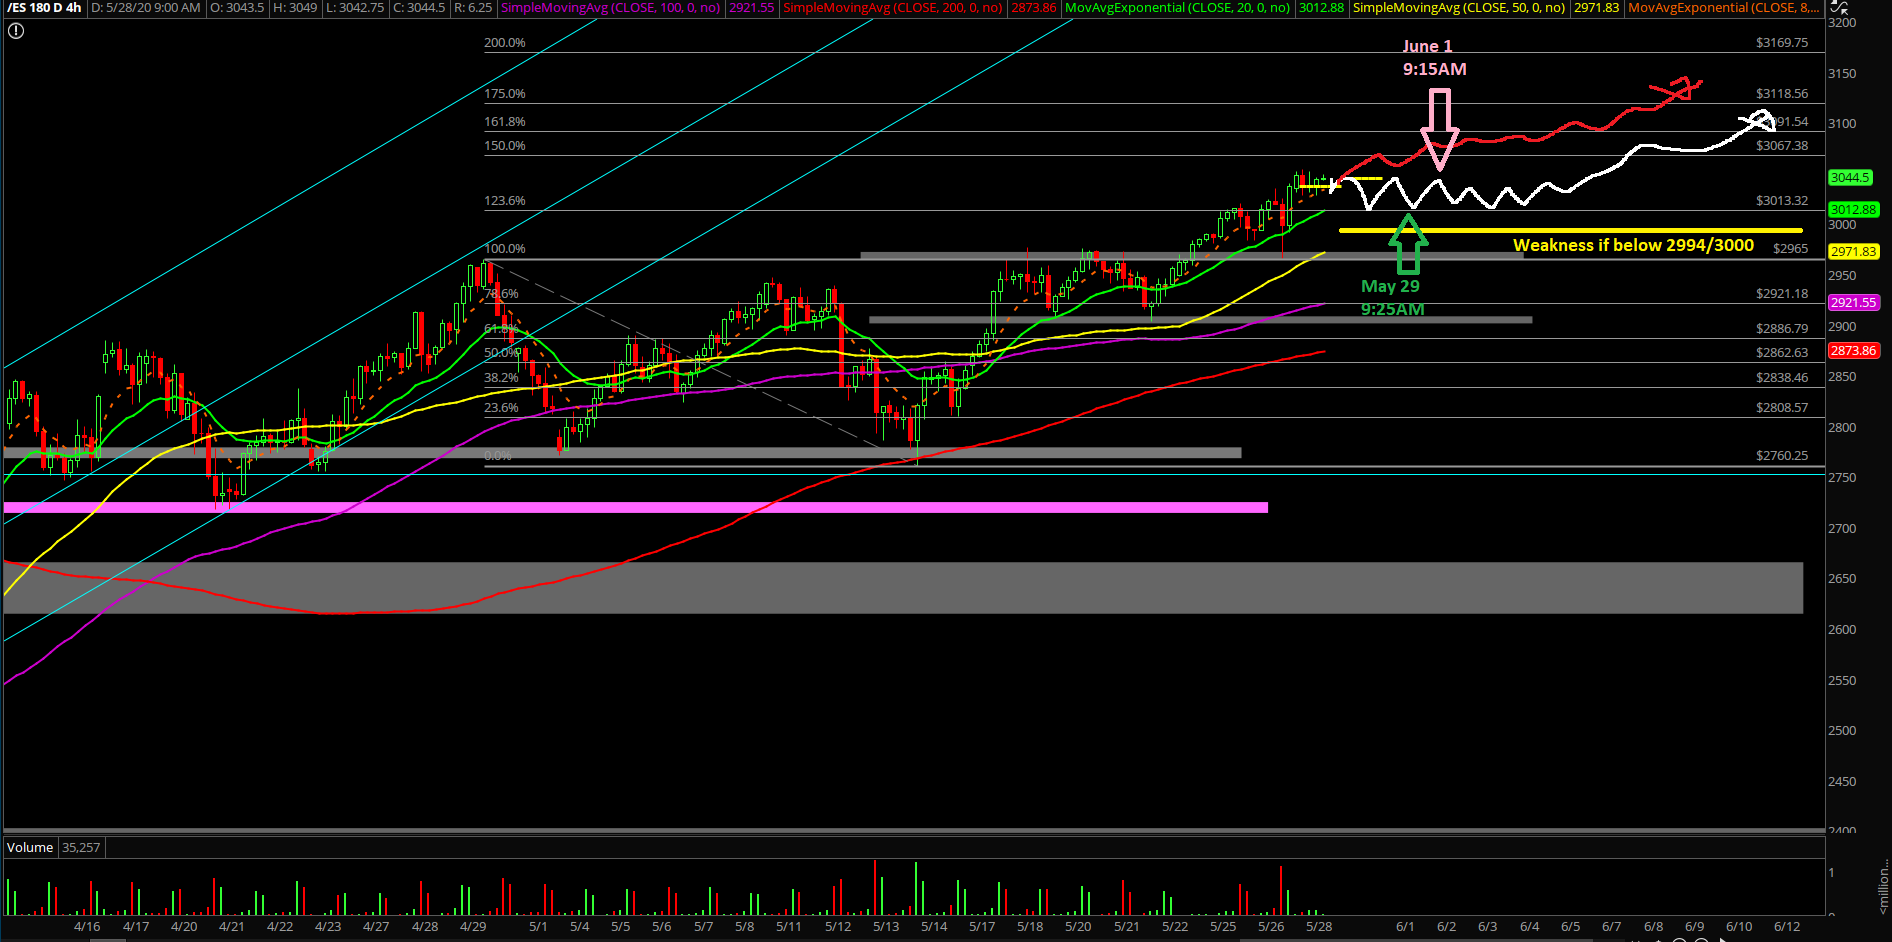
- For now, the 4-hour white line projection from last week remains king given the high level consolidation.
- Our intermediate target is now confirmed at 3135 when price action remains above 2947.5 and specifically when above 2990s due to immediate momentum
- Friendly reminder: the past ~15 sessions, the overnight globex session has showcased better/easier setups than the RTH duration so traders must be aware of the current environment when trading
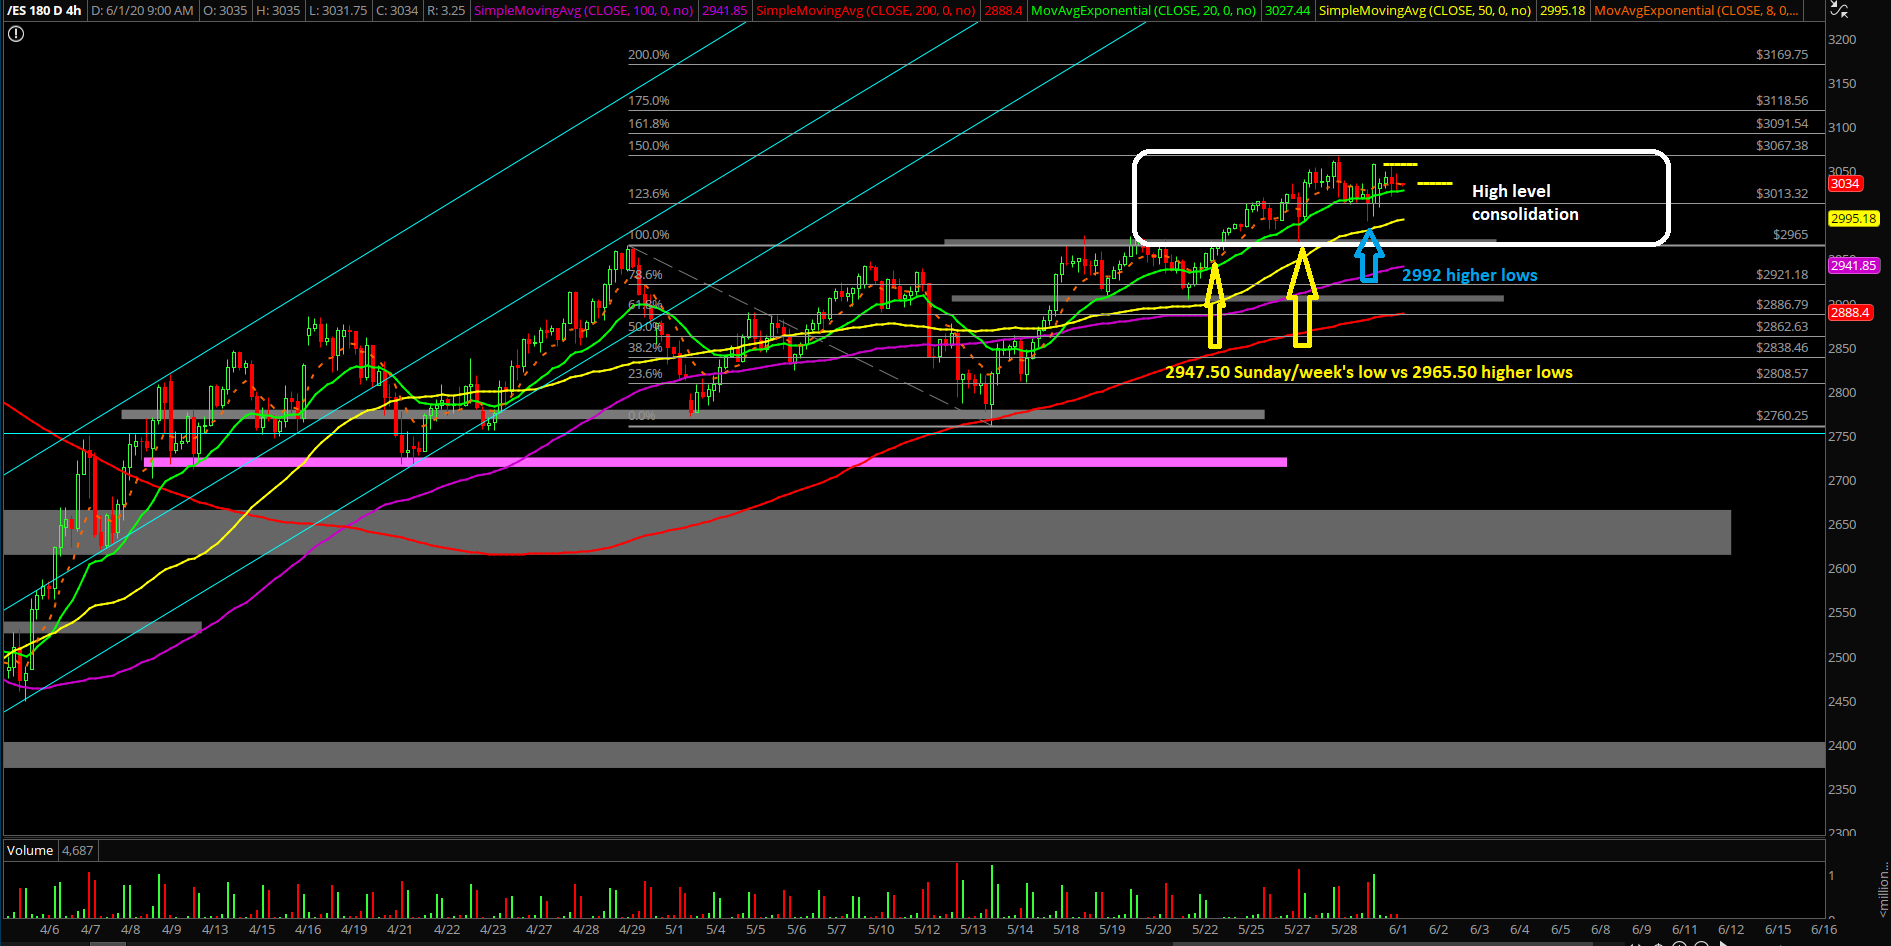
- Zooming in, treat 3000-3050s or 3000-3060s as a high-level consolidation/bull flag structure. Buy near support and don’t get caught in the middle because the edge becomes low. Wait for the eventual upside breakout towards 3135 if price action continues to remain strong
- When price action continues to showcase higher lows structure with 2947.50 vs 2965.5; then all dips into trending supports are considered buyable. Extension targets have been marked yesterday at 3050/3100/3135 with the former already being fulfilled
- When above 2992/3000, the bull train is in an acceleration phase on the daily trend chart.
- Conversely, a massive breakout failure/trap would be considered if price action falls below 2992 and then close below 2947.50 on a daily closing basis.
- For reference, as of June 1st, the daily 20EMA has grinded up to 2940s now.
- Market is definitely at a major inflection point; please see daily/weekly/monthly charts. (this means that you always have to be PREPARED just in case of a ‘shit hits the fan’ moment if a quick turnaround from bears appear. You always have to be prepared for anything even if it is low odds at the current time)
- During the May 11-15th week, price bottomed out at 2760.25 vs our 2752 pre-determined key support level. We bought the dip at 2765 and the market has bounced way more than 100 points given our initial expectations. When bulls are in charge and bears are trapped market participants, there is no reason to doubt until support actually breaks and confirms some sort of breakout failure
- We are on hold for our intermediate bearish bias until there’s a decisive breakdown below 2752, followed by 2717 indicating immediate momentum aligns with micro+intermediate timeframes. Know your timeframes!

