MarketMood Weekend: Warning Bells are Ringing
 By
By
Where We've Been:
Friday's mood pattern showed the bulls slowing down and things were so slow today that the market might as well have been closed. MMI was pointing down, but the relentless bulls managed to eke out a barely positive day.
Today's trader mood context was: "patience, self-restraint"
Today's trader mood challenge was: "agendas, pushing ahead"
Where We're Going
It's difficult to get a good read on the weekend's mood pattern, other than it looks like it's still trying to turn bearish. MMI is pointing down through Monday, MM MACD and MAM are signaling changes. There is no market confirmation yet of a change of trend, but the warning bells are ringing.
New Trend Change Signals: There is a MM MACD swing sell signal for Monday open at or below 2975 SPX. If the market gaps down it will automatically trigger. There is also a MAM downward trend change signal for 9/6-16 (looking for a near term turning down sometime within that window).
MMI Monday open: down
Weekend's trader mood context: "patience, self-restraint"
Weekend's trader mood challenge: "agendas, pushing ahead"
MarketMood Data Info:
Internet search theme MMI inputs (mood vs effect inverted): man, sports, wrong doing, consequences, loser, air, travel, business
Short Term Forecast:
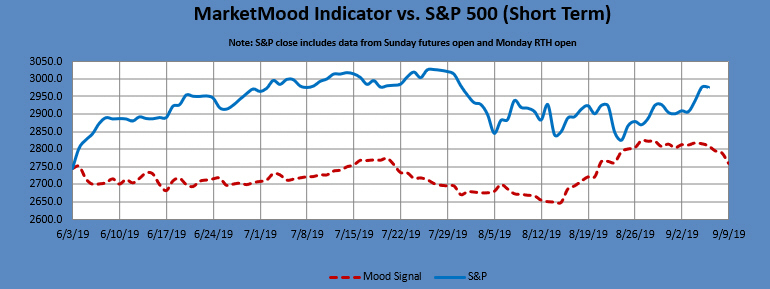
Next 3 Days:
| Date | Daily MMI | MMI 2* |
|---|---|---|
| 9/9 (open) | down | down |
| 9/9 | close below open | down |
| 9/10 | down |
*MMI 2 uses an alternate algorithm to convert the same sentiment source data to S&P direction.
Note: Changes to next day MMI signals occur about 5% of the time, and will be announced in updates as well as the daily report should they occur. Same day signals will not change. Day 2 and 3 signals reflect the most current information, and are subject to change. The default trade per the daily signals is executed at market on close. except on Mondays, as there is a signal for Monday open (i.e. "weekend close") and Monday close. The daily MMI signals are correct as daily direction calls about 63% of the time. Please manage your trading risk accordingly.
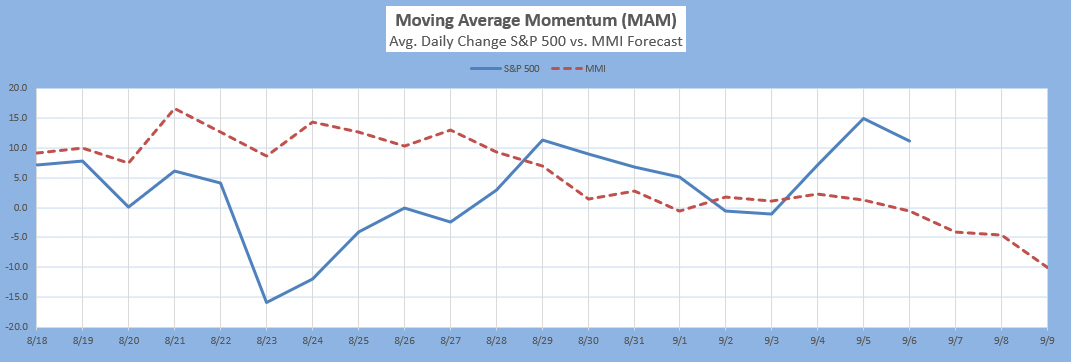
The Moving Average Momentum (MAM) Indicator's last major high signal was 11/1-9. The closing high on 11/7 fulfilled that. The last major low signal was 12/24-31. The market rallied strongly after the close on Dec. 24 which fulfilled the major low signal.
Current Signal: There is a MAM downward trend change signal for 9/6-16 (looking for a near term turning down sometime within that window). IF there is a sharp drop during that window (MAM < -10), that will generate a major low signal, the first one since last December.
Intermediate Term Forecast:
The weekly forecast implies a correcting market. Monthly charts show a market in need of at least a quick correction (which appears to still be in progress). They also show a big trend change around October (base case is from down to up).
MM MACD signal is confirmed SELL and the intermediate trend is DOWN. The swing trade is Sell at or below 2975 SPX.
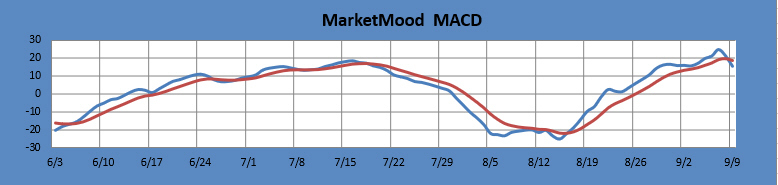
The MM MACD is similar to a standard MACD, except that it uses the MMI signal data to extend several days beyond today, while the standard MACD relies solely on historical market data.
Long Term Forecast:
The situation remains the same. The long term trend indicator (LTTI) continues in bullish trend / topping mode. The long term trend is indicated by the general divergence between the stock market and the mood generated forecast (see long term chart below). The MM Long Term Trend Indicator (bottom chart) which is derived from this divergence, indicates: "Bullish Trend, Hold long long-term positions." The MM LTTI has had this indication since 13 Feb 2019.
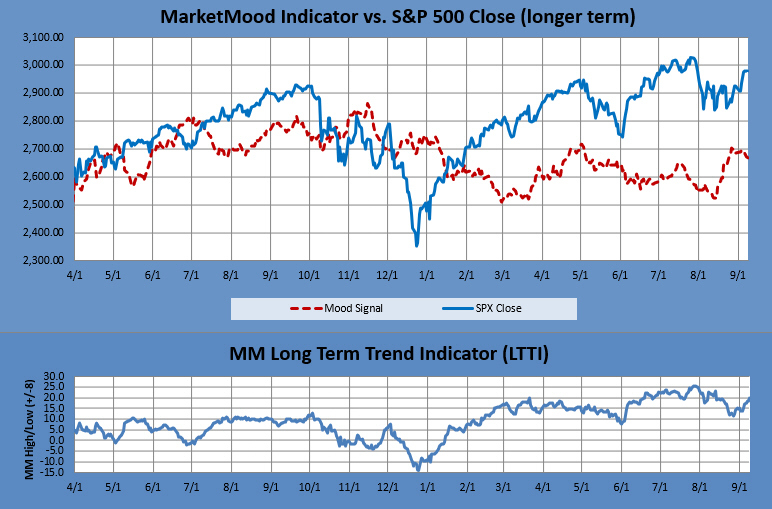
The MM LTTI measures trend strength using the divergence between the market trend and the forecast trend.
