MarketMood Weekend: Stimulating - Market Analysis for Mar 5th, 2021
 By
By
Where We've Been:
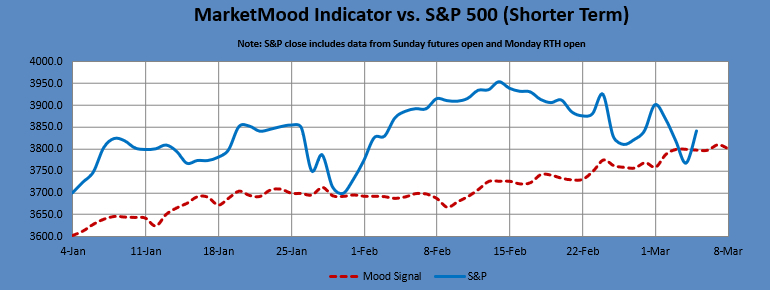
Today's mood pattern can imply a brief international crisis, so we can watch for something along those lines through tomorrow. Perhaps the election in Hong Kong? Covid-19 issues in Europe and Brazil? That might be all there is on this. MMI had no call today. As was said yesterday, the market should be in a zone of support near here. The Shorter Term S&P 500 chart shows 3800 SPX as a preferred area. The Longer Term chart shows 3650 SPX as a price area it would still like the market to at least touch and bounce off of, but it might have to keep on wishing for now. The market tried to break down today, then rallied strongly.
Where We're Heading:
There is no daily MMI call through Monday open as the mood pattern continues to be ambiguous. Although Saturday looks to be an important day related to government assistance (stimulus?). MMI is down (below open) for Monday itself.
MM Trend Trader remains at sell. MM MACD will remain on buy as long as the market stays above 3824 SPX.
Internet search theme source data for MMI inputs: man, writer, controversy, prejudice, sports, winner, international, serious, illness, clothing, freedom, controversy, denial, leader
Next 3 Days:
| Date | Daily MMI | MMI 2* |
| 3/8 (open) | ? | - |
| 3/8 | down | down |
| 3/9 |
*MMI 2 uses an alternate dynamic algorithm to convert the same sentiment source data to S&P direction as the original MMI algorithm.
MM Indicators and Trading Parameters Summary:
| Indicator | Scope | Direction |
| LTTI | Longer Term Trend | Bullish |
| MMTT (main) | Medium Term Trend | Bearish |
| MMTT (HP) | Medium Term Trend | Bearish |
| MMTT (b/b) | Near Term bull/bear Trend Line | 3838 SPX |
| MM MACD | Swing Trade | Buy > 3824 |
| MMI | Next calculated daily sentiment bias | ? |
Note: Medium term is roughly 1 week to 2 months. Longer term is roughly 1 month to 1 year.
Shorter Term MarketMood Indicator vs. S&P 500 Charts:
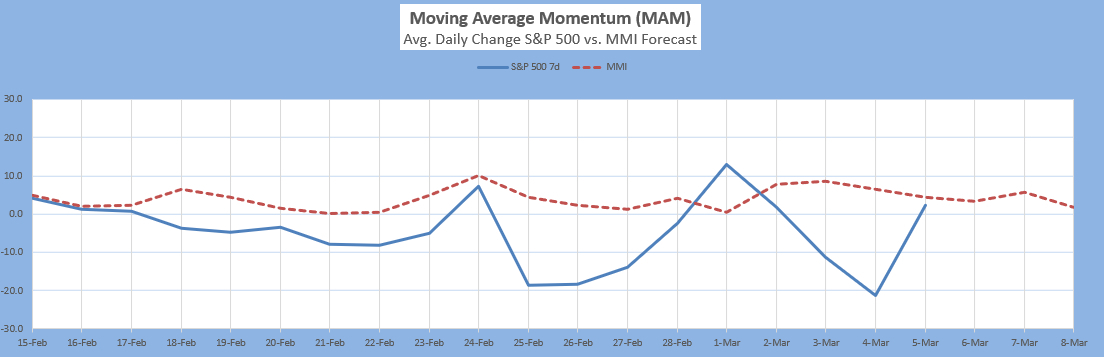
The Moving Average Momentum (MAM): It's been quite a long time since there was a normal major high or low signal. the indicator's last major low signal was 24-31 Dec., 2018. The market rallied strongly following the close on Dec. 24 which fulfilled the major low signal. There was an ambiguous low signal from 20-27 Mar. 2020. It was a combo major low and minor high in the same region. The market did make a substantial low in that time-frame. The last major high signal was 8-27 Jan. 2020 (possibly the longest window ever). The closing high on 17 Jan. appeared to have fulfilled that, as the market dropped over 100 points following this window. Yet, the market quickly recovered its losses and made a new high. However, with that being the first major trend change signal in over a year, we needed to take seriously that it was pointing to something very different happening in both mood and market. Soon after the market saw its largest losses ever. There was an ambiguous combo minor low and major high signal for February 24 - March 3, 2021. It is yet to be seen what significance it might have.
Current status: neutral
Intermediate Term Forecast:
There are multiple possibilities for the month of March depending on whether a flip down occurs or not. The base case is for the current decline to bottom and then for a continuation up to a high in March. The alt case would be for a corrective low in March. Regardless, April and May are likely to be big months in the opposite direction of March. The weekly outlook shows a bearish lean in mood through at least the middle of March. More details are available in the 13 Feb. - 5 Mar. Big Picture Update video.
MarketMood Trend Trader
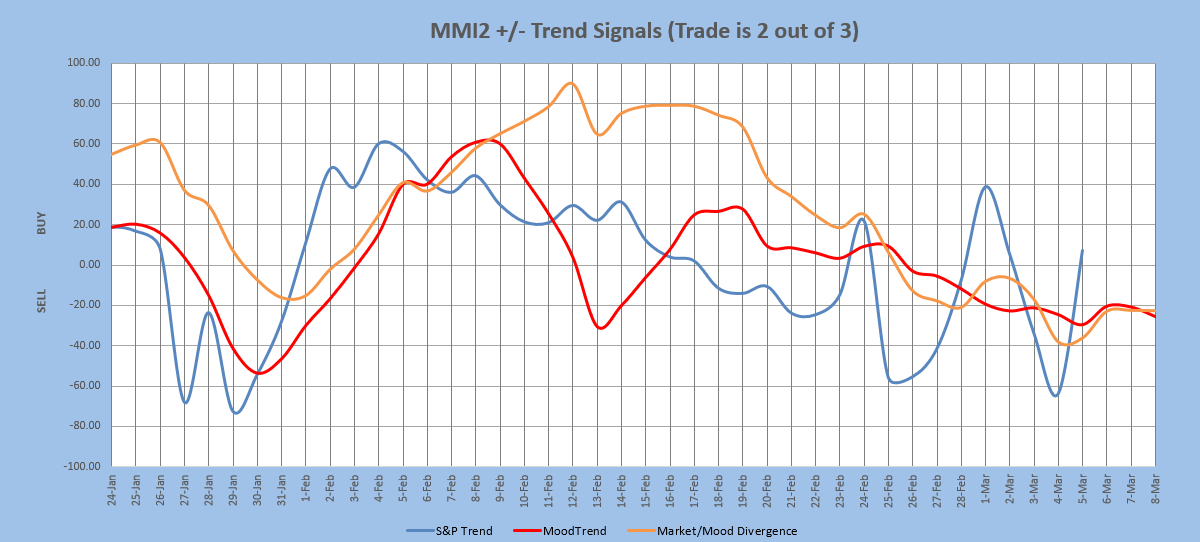
The chart below uses three sentiment trend lines to generate a swing trade signal of BUY if 2 out of 3 are greater than 0 and SELL if 2 out of 3 are less than 0. Trade length averages 9 days, but can be as short as 1 and has been as long as 60. The signal is updated each day after market close. Back-testing shows this signal averaging about 12 SPX points per trade over the last few years. Back-testing a higher probability signal derived only from the two mood related trend lines averages 33 SPX points per trade, but only initiates trades about once every 3 weeks. Note: past performance does not guarantee future results.
Current signal: SELL since 26 Feb. HP signal: SELL since 26 Feb.
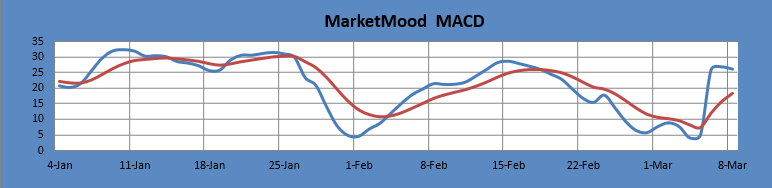
MM MACD signal is BUY and the intermediate trend is bullish > 3824. The swing trade signal is BUY > 3824 SPX (cash).

The MM MACD is similar to a standard MACD, except that it uses the MMI signal data to extend several days beyond today, while the standard MACD relies solely on historical market data.
Long Term Forecast:
The long term trend is indicated by the general divergence between the stock market and the mood generated forecast (see long term chart below). The MM Long Term Trend Indicator (bottom chart) which is derived from this divergence, indicates: "Bullish Trend, hold long long-term positions." The MM LTTI has had this indication since 4 Nov 2020.
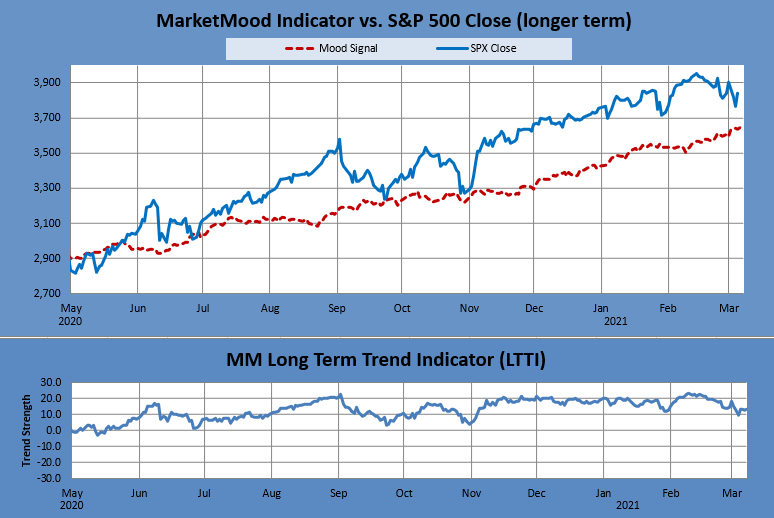
The MM LTTI measures trend strength using the divergence between the market trend and the forecast trend.
For the Extremely Curious:
In normal mode, the top of the mood chart is primary, and in inverted mode the bottom of the chart is. Normal mode is currently in effect.
Tomorrow's market mood and news themes: denial, irrational decisions
Tomorrow's trader context is: decision time
Limitations:
MMI does least well in these conditions-- 1) EW 4th wave, 2) EW b wave, 3) Diagonals, and 4) Topping. More than one of these conditions concurrently present will further diminish performance.
Note: Changes to next day MMI signals occur about 5% of the time, and will be announced in updates as well as the daily report should they occur. Same day signals will not change. Day 2 and 3 signals reflect the most current information, and are subject to change. The default trade per the daily signals is executed at market on close. except on Mondays, as there is a signal for Monday open (i.e. "weekend close") and Monday close. Historical data implies that the daily MMI signals tend to be correct as daily direction calls about 63% of the time over the long term.
