MarketMood Weekend: Seeking Balance
 By
By
Where We've Been:
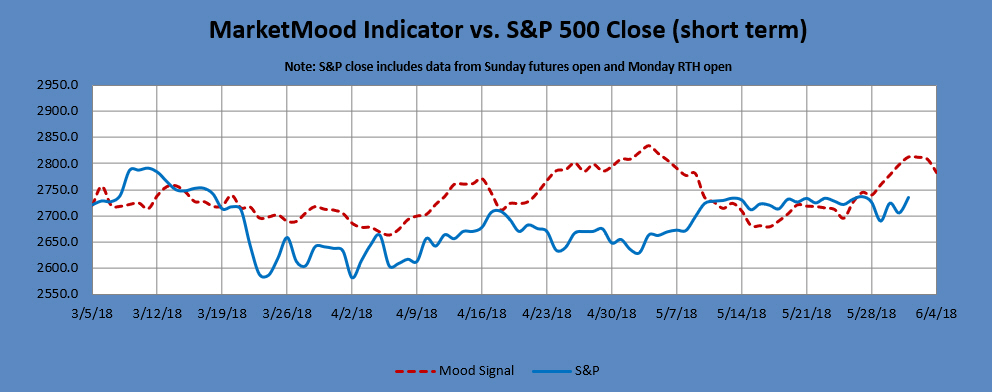
MMI continued to point up for Friday, and the final day of a three day "bullish exhaustion" component continued to indicate that the bulls are not done giving it their all. Yet, because of an indication of a likely top in the mood pattern for Wednesday-Thursday (as well as Thursday's market action), I wondered if bulls might not have much push left and might possibly not make it through the end of the day. They definitely made it through! We'll now have to look to the weekend and early next week to see what exactly exhausted bulls will do this time.
MMI for Friday was: close up; S&P 500 closed +1.08%
Where We're Heading:
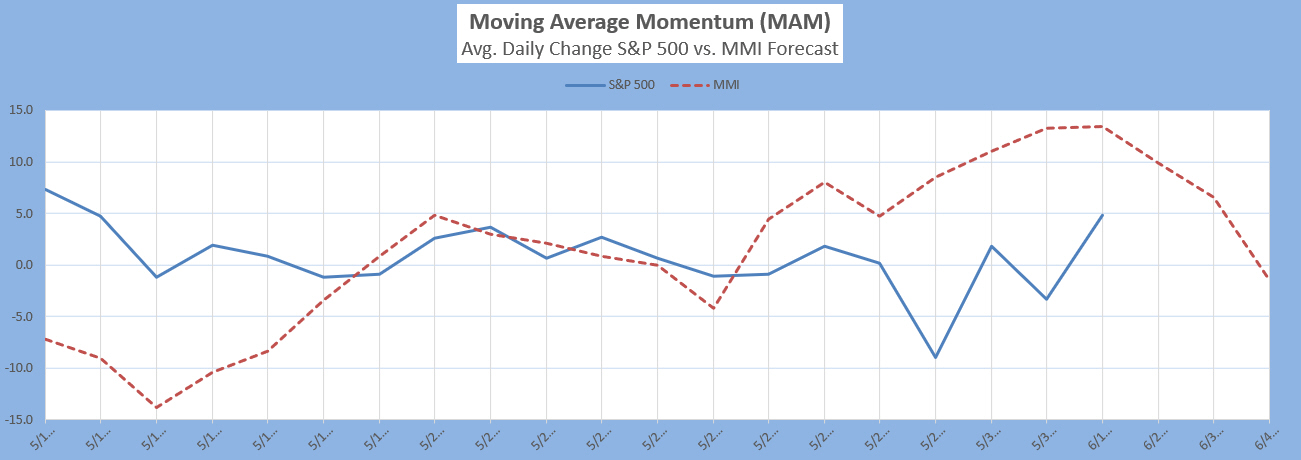
The weekend mood pattern has a somewhat serious tone, but might simply be reflecting the lowered energy of the weekend after a hectic week. It could also be reflecting a seeking of balance or fair play. MMI is looking down, but the MAM doesn't cross into negative momentum territory until Monday. Will that mean a slow or ambivalent weekend? We'll see.
MMI for Monday open: down
MMI for Monday: close down (below open)
MarketMood Data Info:
Internet search theme MMI inputs (mood vs. effect currently inverted): man, rap music, argument, woman, profanity, controversy, apology, sports, losers, wasting time, mistake, tweet, controversy, prejudice, death, nostalgia, calendar, ritual, international, creative, scientist, remembered, video game, business
Short Term Forecast:
Next 3 Days:
| Date | Daily MMI |
|---|---|
| 6/4 (open) | down |
| 6/4 | close down |
| 6/5 |
The Moving Average Momentum (MAM) Indicator last signaled a major trend change with a major LOW indication between April 18-25. The MAM signaled an important trend change May 30 - June 8 (it still hasn't specified a particular direction).
Note: Changes to next day MMI signals occur about 5% of the time, and will be announced in updates as well as the daily report should they occur. Same day signals will not change. Day 2 and 3 signals reflect the most current information, and are subject to change. The default trade per the daily signals is executed at market on close. except on Mondays, as there is a signal for Monday open (i.e. "weekend close") and Monday close. The daily MMI signals are correct as daily direction calls about 63% of the time. Please manage your trading risk accordingly.
Intermediate Term Forecast:
The primary outlook is that a countertrend corrective move is in progress. . Monthly charts show a low June-July.
MM MACD signal is unconfirmed BUY, and the intermediate trend is DOWN. The trade signal is N/A.
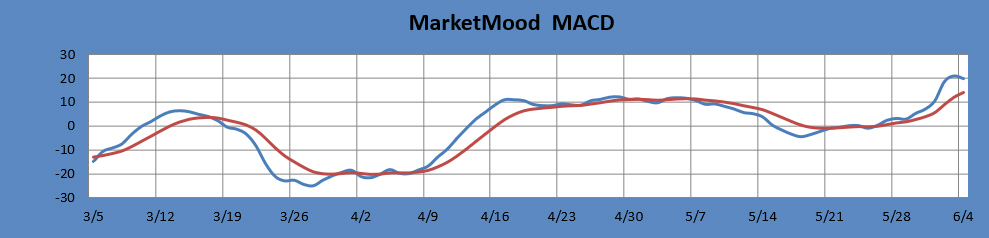
The MM MACD is similar to a standard MACD, except that it uses the MMI signal data to extend several days beyond today, while the standard MACD relies solely on historical market data.
Long Term Forecast:
The long term forecast remains strongly bullish. The bullish long term trend is indicated by the generally positive divergence between the stock market and the mood generated forecast (see long term chart below). The MM Long Term Trend Indicator (bottom chart) which is derived from this divergence, indicates: Bullish Trend, hold long positions. The MM LTTI has had this same bullish indication since 12 Sept., 2016.
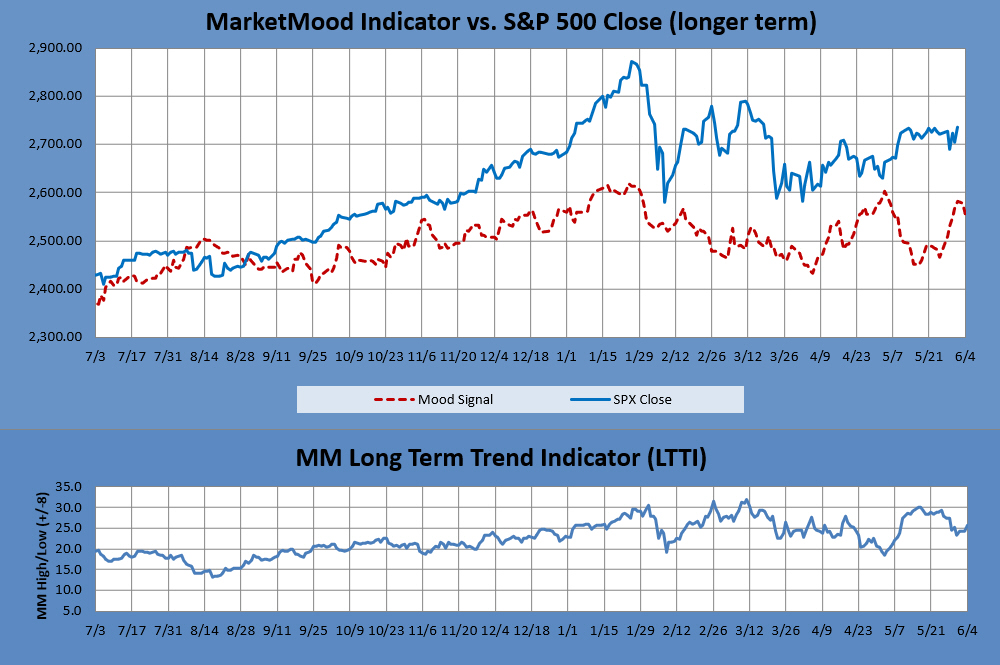
The MM LTTI measures trend strength using the divergence between the market trend and the forecast trend. A move above +8 or below -8 is bullish or bearish respectively. A value over 10 or under -10 followed by a move back through +/-8 signals a high or low is likely in. A subsequent move below +5 (or above-5) signals a trend change to bearish (or bullish).
