MarketMood Weekend: Preparing for What's Next
 By
By
Where We've Been:
Friday's MMI was down, but once again it was advised not to take that for granted. The mood pattern was irrational and risk averse, but there was also an implied desire to look at the bright side and it was cautioned that this could win out. The market started the day sharply down, but by the end of the day it was just north of zero.
There was a multi-day high magnitude MM turn date from 2/5-2/8 with 2/8 being the focal point. After observing the market's behavior, my base case is that 2/5 marked the high and today, 2/8 marked the end of this 4 day turning point, a first leg of a longer downturn.
MMI for Friday was: close down; S&P 500 closed +0.07%.
Where We're Heading:
The weekend MMI is net up for Monday open. A complex mood pattern, and a signal flip over the weekend add uncertainty and likely turbulence prior to RTH open. Monday's mood pattern reflects strong emotions and MMI is pointing down (below open).
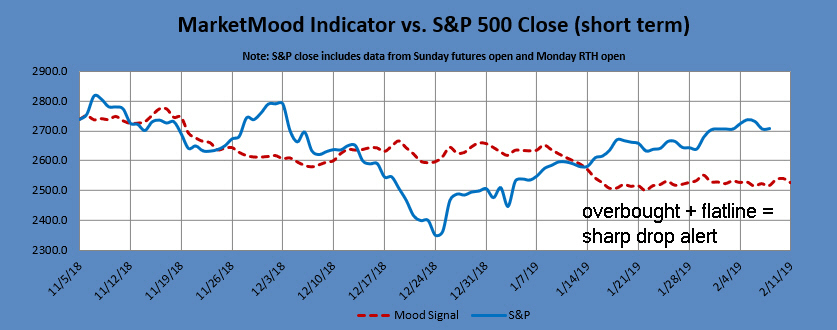
Sharp drop alert: Conditions are still present for a sharp drop alert (overbought + flatline, see 1st chart below).
MMI for Monday open: up (caution advised)
MarketMood Data Info:
Internet search theme MMI inputs (mood vs. effect reverting to normal): beginning, celebration, moon, international, time, president, speech, government, home, death, tv, star, family, grief, suicide
Short Term Forecast:
Next 3 Days:
| Date | Daily MMI |
|---|---|
| 2/11 (open) | up |
| 2/11 | close down (below open) |
| 2/12 |
Note: Changes to next day MMI signals occur about 5% of the time, and will be announced in updates as well as the daily report should they occur. Same day signals will not change. Day 2 and 3 signals reflect the most current information, and are subject to change. The default trade per the daily signals is executed at market on close. except on Mondays, as there is a signal for Monday open (i.e. "weekend close") and Monday close. The daily MMI signals are correct as daily direction calls about 63% of the time. Please manage your trading risk accordingly.
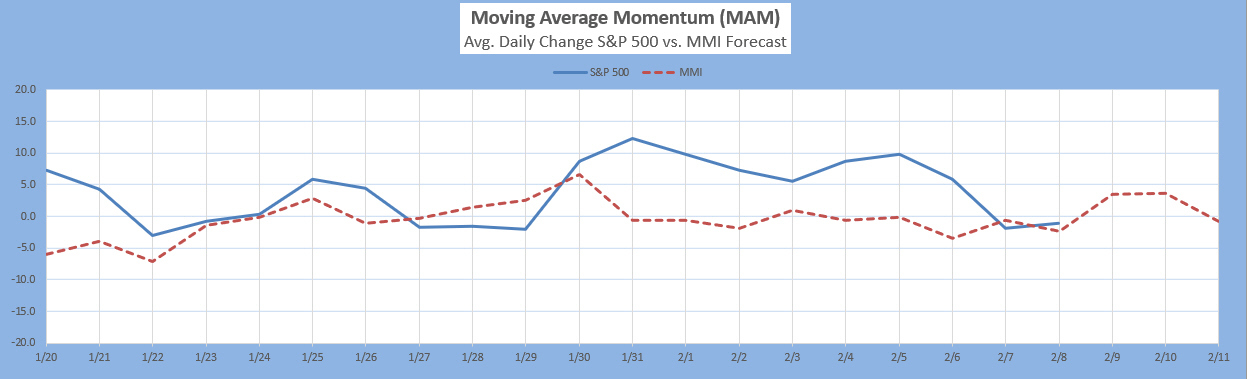
The Moving Average Momentum (MAM) Indicator's last major high signal was 11/1-9. The closing high on 11/7 fulfilled that. The last major low signal was 12/24-31. The market rallied strongly after the close on Dec. 24 which fulfilled the major low signal.
Intermediate Term Forecast:
The primary outlook is that a corrective move is in progress. Weekly charts are primarily down over the next few weeks. Monthly charts shows the market to be primarily in a corrective mostly downward move through March then turning up. A next low is anticipated February/March.
MM MACD signal is NEUTRAL and the intermediate trend is UP. There is no swing trade signal.
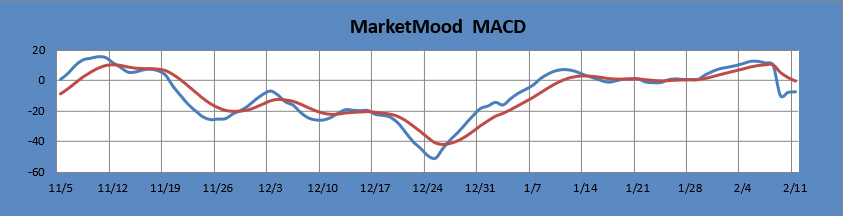
The MM MACD is similar to a standard MACD, except that it uses the MMI signal data to extend several days beyond today, while the standard MACD relies solely on historical market data.
Long Term Forecast:
The long term forecast continues in bullish territory. Since a two year bullish trend has recently concluded, the trend may now vacillate between bearish, neutral and bullish for a bit before firmly deciding on its long term trend. The long term trend is indicated by the general divergence between the stock market and the mood generated forecast (see long term chart below). The MM Long Term Trend Indicator (bottom chart) which is derived from this divergence, indicates: Bullish Trend, enter bullish long term positions. The MM LTTI has had this indication since 27 Dec., 2018.
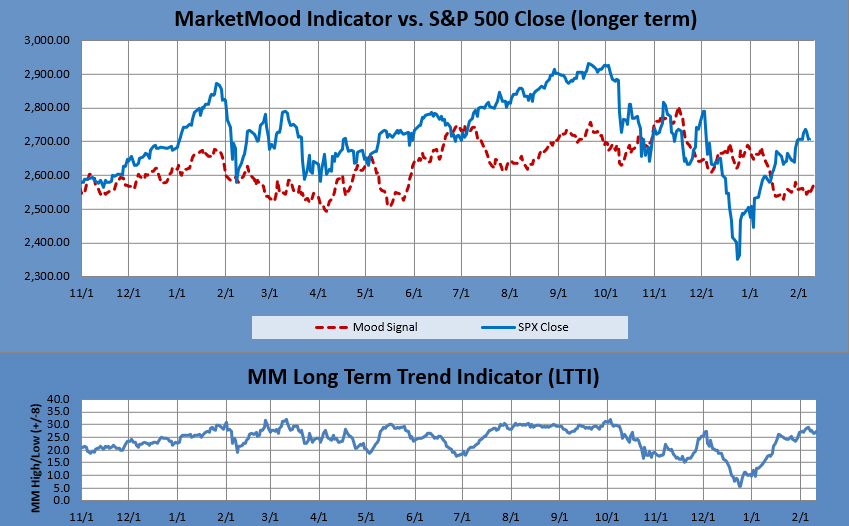
The MM LTTI measures trend strength using the divergence between the market trend and the forecast trend. A move above +8 or below -8 is bullish or bearish respectively. A value over 10 or under -10 followed by a move back through +/-8 signals a high or low is likely in. A subsequent move below +5 (or above-5) signals a trend change to bearish (or bullish).
