MarketMood Weekend: On Watch
 By
By
Where We've Been:
Friday's mood pattern showed a day that was perhaps too quiet, like a calm before the storm. MarketMood Indicator (MMI) was pointing up and the market stayed pretty quiet, going from a slight rally to a slightly down close.
Where We're Heading:
The mood pattern for Sunday often accompanies serious or disruptive events-- so we'll be on the lookout Sunday and Monday for that possibility. MMI is down for Monday RTH open, but after final data it turned up (above open) for Monday itself. There is no clear directional call for Tuesday.
MM Trend Trader remains full on bullish. A break below the bull / bear trend line would imply the beginning of a temporary sell-off which may or may not be sizeable, but likely short-lived.
Sharp Drop Alert: There is a sharp drop alert through Tuesday. These usually accompany EW c waves and point to an added risk for moves in excess of what has been the recent average daily move down (most often between 1-3% when a daily sharp drop does occur). They are not sell signals, but caution that conditions are right for a possible sharp drop to occur -- i.e. take any necessary precautions.
Internet search theme source data for MMI inputs: man, rap music, shooting, death, police, movie, news, wrong-doing, consequences, sports, past, violence, relationship, police, video, government, leader, advocacy, legal, prison, murder, international, winners
Next 3 Days (days 2 and 3 are considered preliminary):
Date | Daily MMI | MMI 2* | CDMS** |
11/22 (open) | Down | - | |
11/22 | Up | - | No Trade |
11/23 | ? | Up | No Trade |
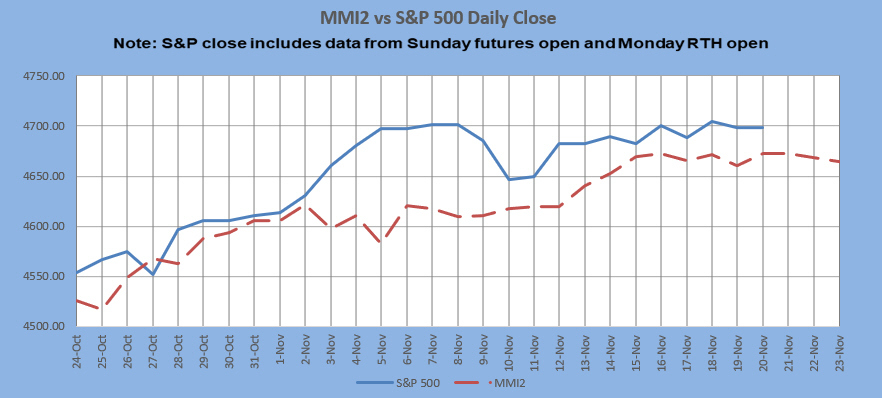
*MMI 2 uses an alternate dynamic algorithm to convert the same sentiment source data to S&P direction as the original MMI algorithm.
**Composite Daily Mood Signal (CDMS) combines the MMI daily signal and the various MM trend and trading indicators into one overall daily trade signal. Possible signals are buy, strong buy, no trade, sell, and strong sell. FYI-- hypothetical daily close to close trade stats so far: 3/3 strong buys (100%), 6/9 buys (67%), 5/13 sells (38%), 35 no trade days. Nov.: 1/3 sells (33%), 12 no trade days.
Latest charts follow the summary table.
MM Indicators and Trading Parameters Summary:
Indicator | Scope | Direction |
LTTI | Longer Term Trend | Bullish |
MMTT (main) | Medium Term Trend | Bullish |
MMTT (HP) | Medium Term Trend | Bullish |
MMTT (b/b) | Near Term bull/bear Trend Line | 4694 SPX (cash) |
MM MACD | Swing Trade | Neutral |
Note: Medium term is roughly 1 week to 2 months. Longer term is roughly 1 month to a year or more.
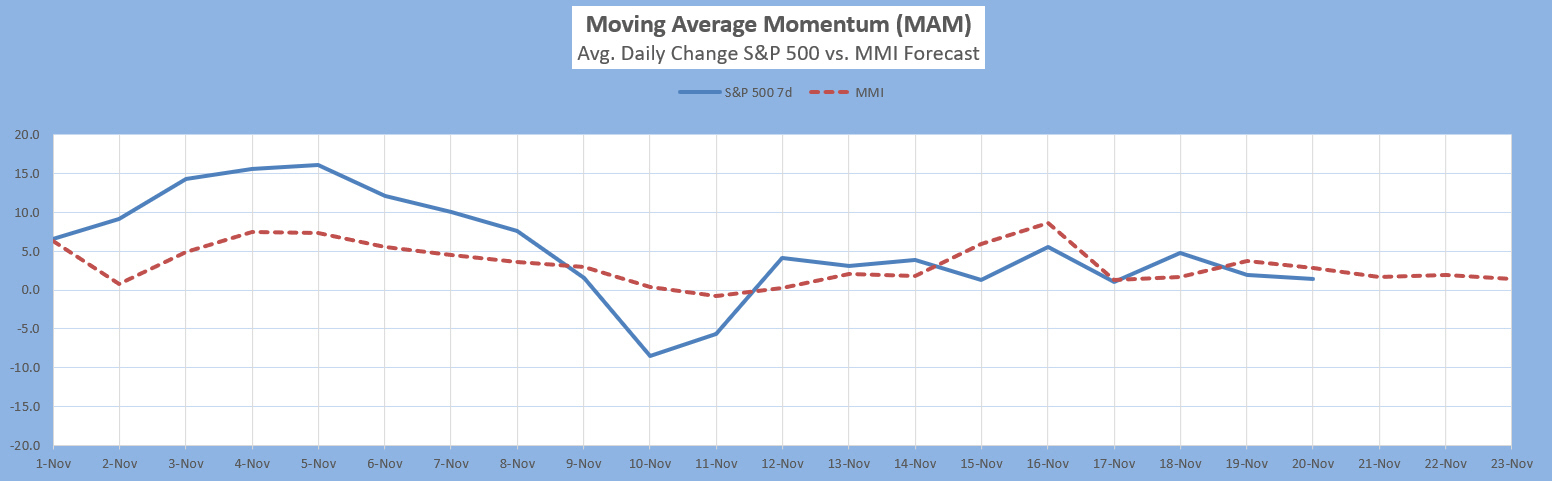
The Moving Average Momentum (MAM): It's been quite a long time since there was a normal major high or low signal.
Current status: neutral
Intermediate Term Forecast:
The larger market trend remains up, with a pullback that may still be in progress although looking less likely. The remainder of the year, the market should continue in its topping process, getting ready for what could be a substantial pullback for early 2022.
MarketMood Trend Trader
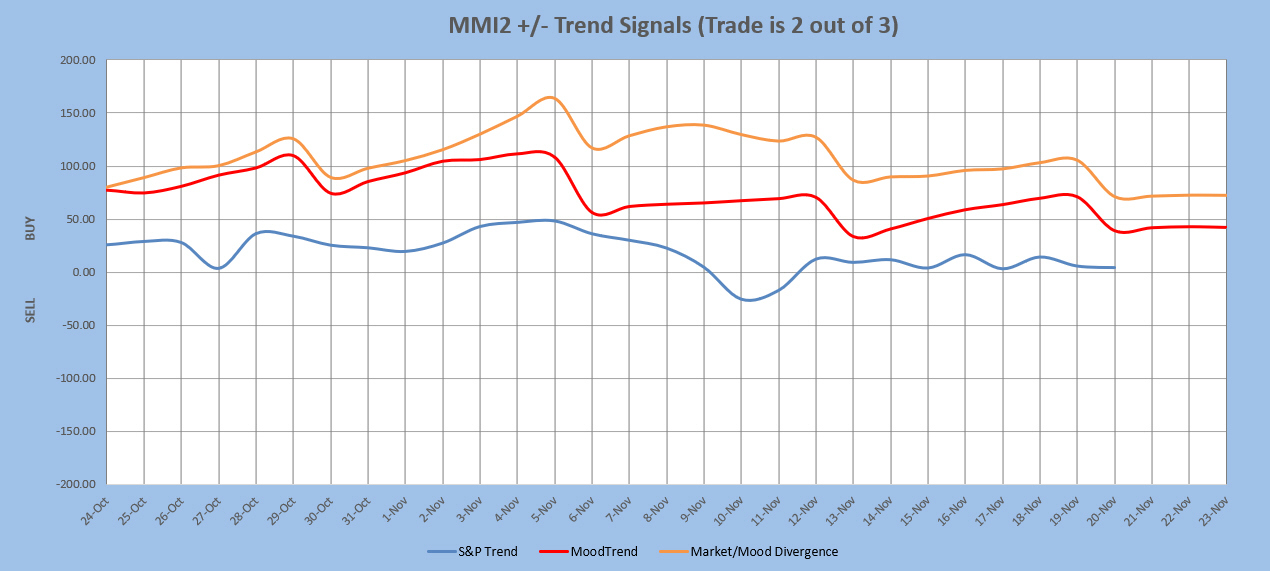
The chart below uses three sentiment trend lines to generate a swing trade signal of BUY if 2 out of 3 are greater than 0 and SELL if 2 out of 3 are less than 0. Trade length averages 9 days, but can be as short as 1 and has been as long as 60. The signal is updated each day after market close. Back-testing shows this signal averaging about 12 SPX points per trade over the last few years. Back-testing a higher probability signal derived only from the two mood related trend lines averages 33 SPX points per trade, but only initiates trades about once every 3 weeks. Note: past performance does not guarantee future results.
Current signal: Buy since 15 Oct. HP signal: Buy since 24 Oct.
MM MACD signal is SELL and the intermediate trend is UP. There is no swing trade signal.
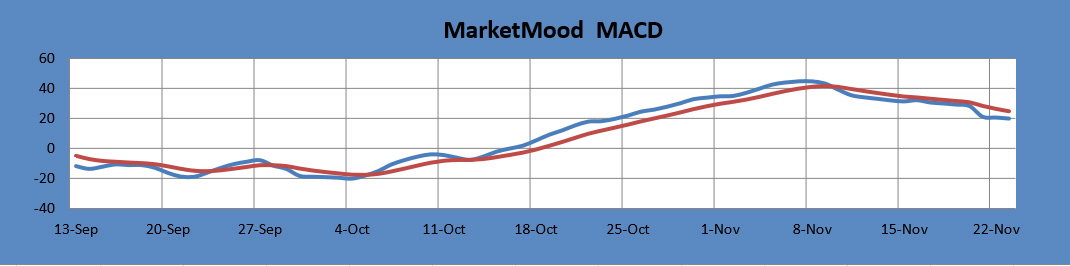
The MM MACD is similar to a standard MACD, except that it uses the MMI signal data to extend several days beyond today, while the standard MACD relies solely on historical market data.
Long Term Forecast:
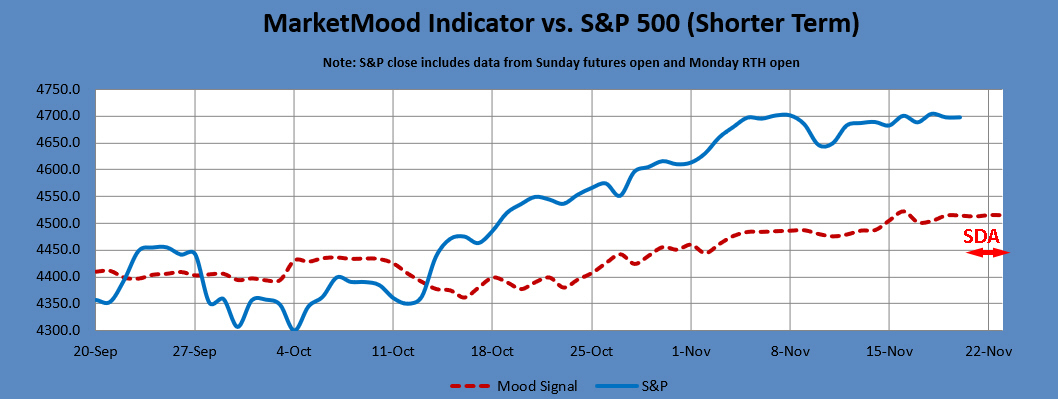
The long term trend is indicated by the general divergence between the stock market and the mood generated forecast (see long term chart below). The MM Long Term Trend Indicator (bottom chart) which is derived from this divergence, indicates: "Bullish Trend, hold long long-term positions." The MM LTTI has had this indication since 4 Nov 2020.
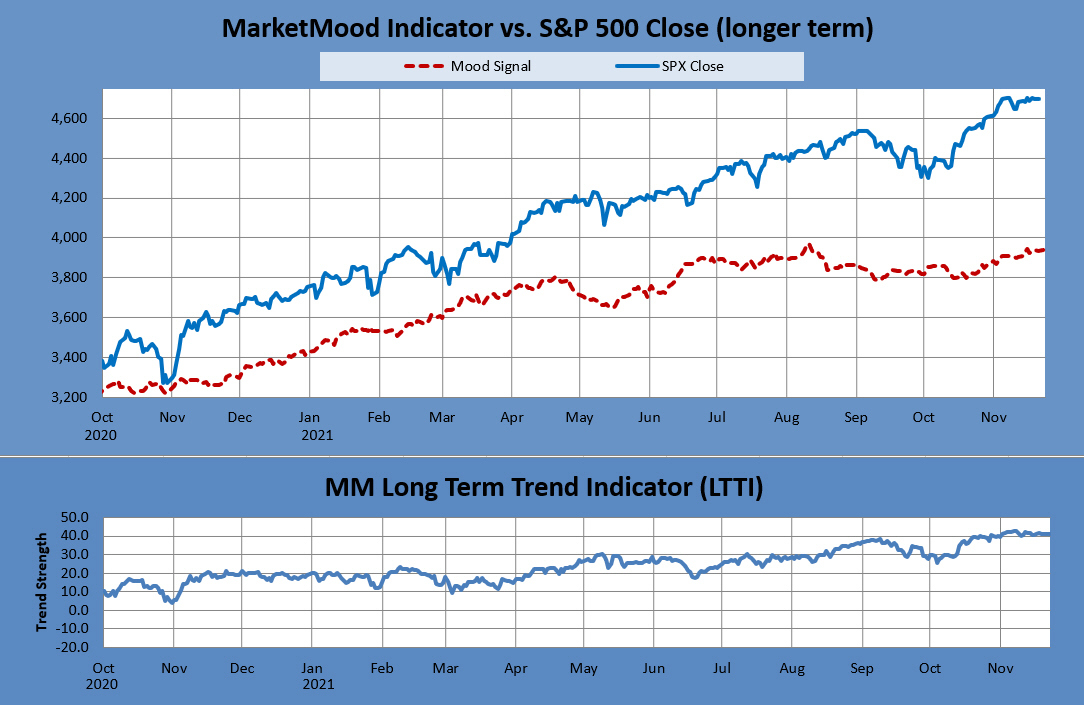
The MM LTTI measures trend strength using the divergence between the market trend and the forecast trend.
Note: Changes to next day MMI signals occur about 5% of the time, and will be announced in updates as well as the daily report should they occur. Same day signals will not change. Day 2 and 3 signals reflect the most current information, and are subject to change. The default trade per the daily signals is executed at market on close. except on Mondays, as there is a signal for Monday open (i.e. "weekend close") and Monday close. Historical data implies that the daily MMI signals tend to be correct as daily direction calls about 63% of the time over the long term.
