MarketMood Weekend: It's Not What It Seems
 By
By
Where We've Been:
MMI was down today and the market closed sharply down although off the lows of the day. CDMS is registered its second Strong Sell signal (strong odds of a daily negative close) since tracking began in September (the other one was on Tuesday).
Where We're Heading:
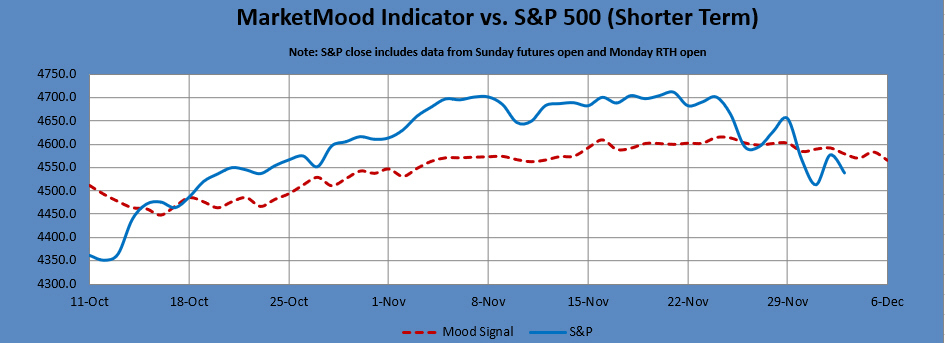
The mood pattern for the weekend implies that there are some incorrect assumptions in play and even a blatant denial of the facts. It's a guarantee that things are not as they currently appear and by Monday things could be markedly different.
MMI is mixed for the weekend, but net up for RTH open. Pressure for a good bounce is beginning to build, however, MMI for Monday is down (below open) and CDMS (preliminary) is a strong sell for Monday. It's important to know that the final call for Monday's CDMS is not set until after Monday RTH open, so it could potentially change on Monday morning.
As long as the higher probability signal stays on the sidelines, MM Trend Trader's main signal is currently bullish or bearish depending on which side of the bull/bear trendline the market closes on. For now, it's bearish. If RTH Monday opens > 4569, it will turn bullish, at least for the day.
Internet search theme source data for MMI inputs: man, shooting, legal, jail, death, injuries, art, history, honored, music, internet, nostalgia, school, police, emotional, international, science, creative, losers
Next 3 Days (days 2 and 3 are considered preliminary):
Date | Daily MMI | CDMS** |
12/6 (open) | Up | X |
12/6 | Down | Strong Sell (prelim) |
12/7 |
**Composite Daily Mood Signal (CDMS) combines the MMI daily signal and the various MM trend and trading indicators into one overall daily trade signal. Possible signals are buy, strong buy, no trade, sell, and strong sell. A "strong" signal impkies a greater probability of success, not necessarily a higher number of points for the day. FYI-- hypothetical daily close to close trade stats so far: 3/3 strong buys (100%), 8/11 buys (73%), 5/13 sells (38%), 2/2 strong sells (100%), 41 no trade days. Dec.: 1/1 strong sells (100%), 2 no trade days.
Latest charts follow the summary table.
MM Indicators and Trading Parameters Summary:
Indicator | Scope | Direction |
LTTI | Longer Term Trend | Bullish |
MMTT (main) | Medium Term Trend | Bearish < 4569 |
MMTT (HP) | Medium Term Trend | Neutral |
MMTT (b/b) | Near Term bull/bear Trend Line | 4569 SPX (cash) |
MM MACD | Swing Trade | Neutral |
Note: Medium term is roughly 1 week to 2 months. Longer term is roughly 1 month to a year or more.
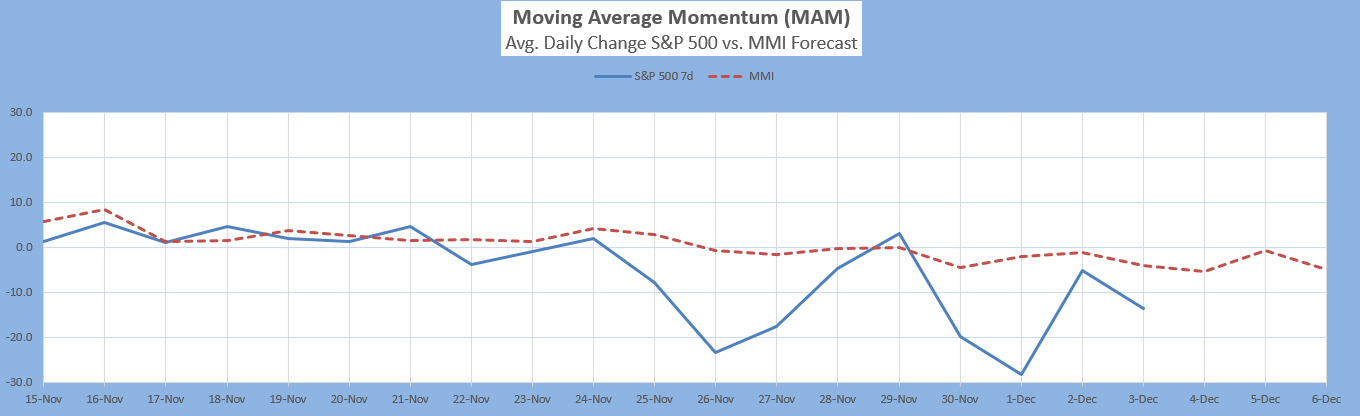
The Moving Average Momentum (MAM): It's been quite a long time since there was a normal major high or low signal. The indicator's last major low signal was Dec. 24-31, 2018. The market rallied strongly following the close on Dec. 24 which fulfilled the major low signal. There was an ambiguous low signal from Mar. 20-27, 2020. It was a combo major low and minor high in the same region. The market did make a substantial low in that time-frame. The last major high signal prior to March of this year was Jan. 8-27, 2020 (possibly the longest window ever). The closing high in that window was 3330 on the 17th then again 3326 on the 23rd. The S&P 500 dropped about 100 points from there through end of month, which was the largest drop in some time. The market then rallied through February 19th to 3386, 60 points above the last high. That was the actual high point, about 3 weeks past this 3 week window. It most definitely was a major high point as it was followed by a steep drop of almost 1000 points before a closing low on March 23, 2020. The most recent major high signal was March 10-17, 2021. The closing high on March 17th was followed by a decline of less than two weeks which was highly unusual for a major high/low signal.
Current status: moderately oversold
Intermediate Term Forecast:
The intermediate market trend has turned down within a longer term bullish trend. The remainder of the year, the market should continue in its topping process (if it hasn't already topped), getting ready for what could be a substantial pullback for early 2022.
MarketMood Trend Trader
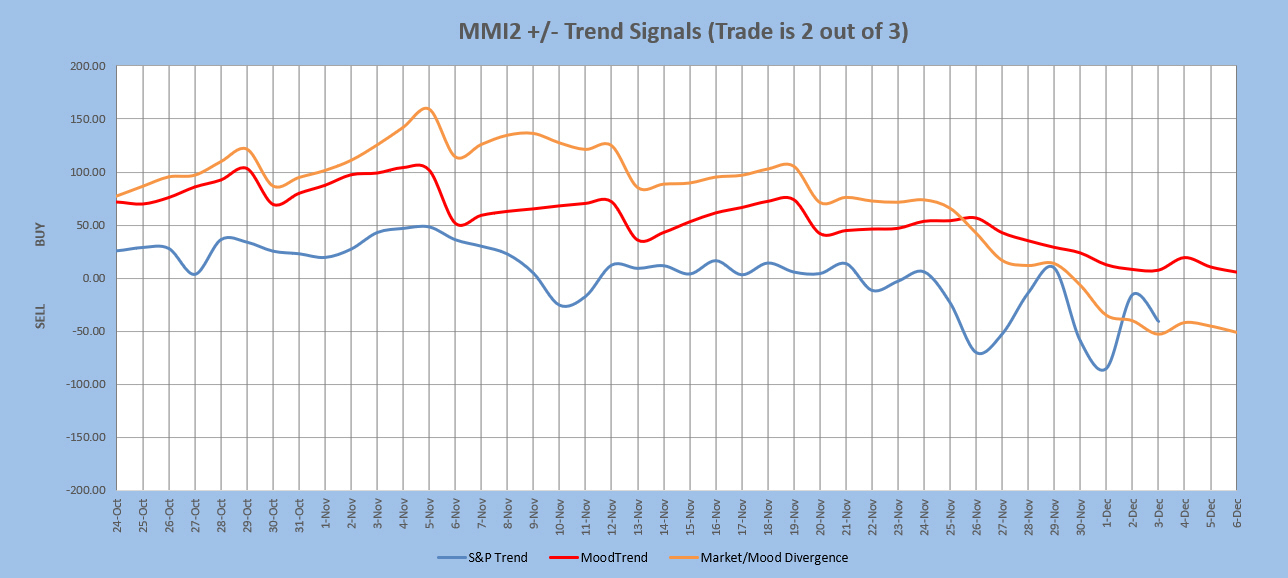
The chart below uses three sentiment trend lines to generate a swing trade signal of BUY if 2 out of 3 are greater than 0 and SELL if 2 out of 3 are less than 0. Trade length averages 9 days, but can be as short as 1 and has been as long as 60. The signal is updated each day after market close. Back-testing shows this signal averaging about 12 SPX points per trade over the last few years. Back-testing a higher probability signal derived only from the two mood related trend lines averages 33 SPX points per trade, but only initiates trades about once every 3 weeks. Note: past performance does not guarantee future results.
Current signal: Sell since 30 Nov. HP signal: Neutral since 30 Nov.
MM MACD signal is NEUTRAL and the intermediate trend is DOWN. There is no swing trade signal.
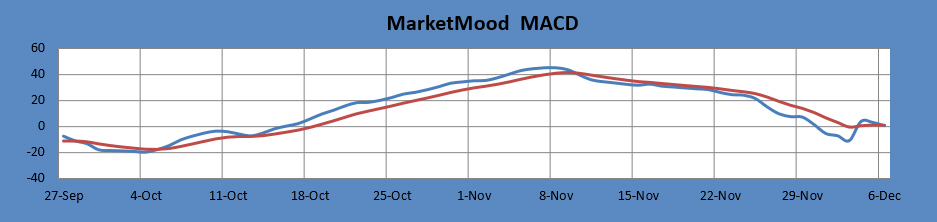
The MM MACD is similar to a standard MACD, except that it uses the MMI signal data to extend several days beyond today, while the standard MACD relies solely on historical market data.
Long Term Forecast:
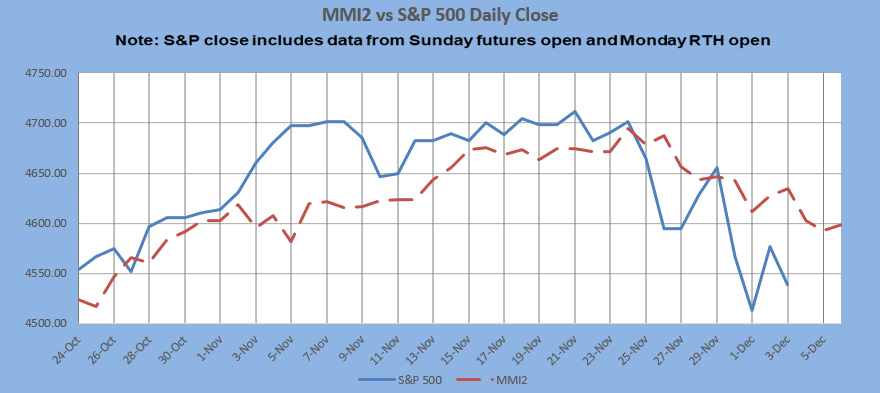
The long term trend is indicated by the general divergence between the stock market and the mood generated forecast (see long term chart below). The MM Long Term Trend Indicator (bottom chart) which is derived from this divergence, indicates: "Bullish Trend, hold long long-term positions." The MM LTTI has had this indication since 4 Nov 2020.
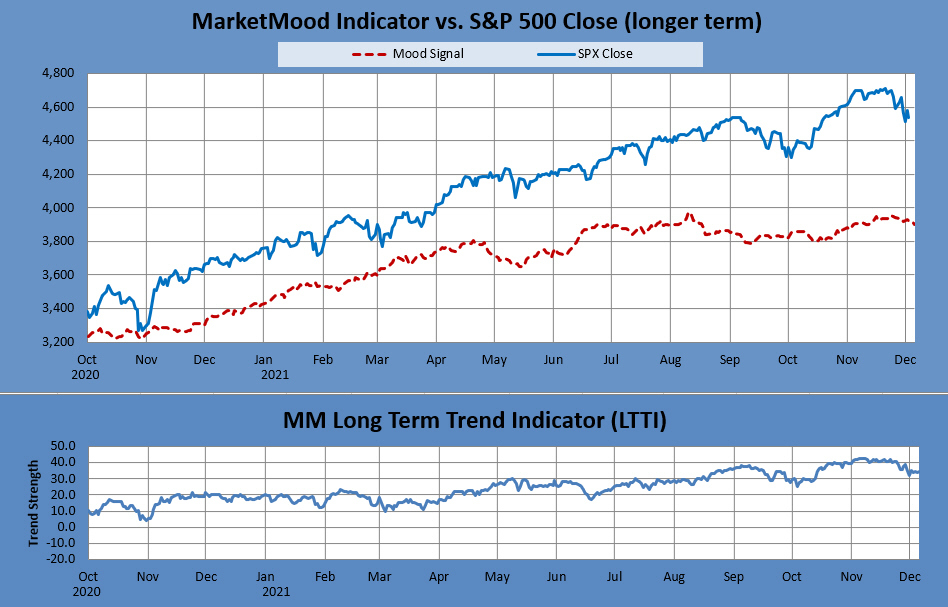
The MM LTTI measures trend strength using the divergence between the market trend and the forecast trend.
For the Extremely Curious:
In normal mode, the top of the mood chart is primary, and in inverted mode the bottom of the chart is. Normal mode is currently assumed to be in effect.
Tomorrow's market mood and news themes: denial, wrong assumptions
Tomorrow's trader context: shifting situations
Limitations:
MMI does least well in these conditions-- 1) EW 4th wave, 2) EW b wave, 3) Diagonals, and 4) Topping. More than one of these conditions concurrently present will further diminish performance.
Note: Changes to next day MMI signals occur about 5% of the time, and will be announced in updates as well as the daily report should they occur. Same day signals will not change. Day 2 and 3 signals reflect the most current information, and are subject to change. The default trade per the daily signals is executed at market on close. except on Mondays, as there is a signal for Monday open (i.e. "weekend close") and Monday close. Historical data implies that the daily MMI signals tend to be correct as daily direction calls about 63% of the time over the long term.
