MarketMood Weekend: Hot and Heated
 By
By
Where We've Been:
MarketMood Indicator was down today and the market closed way down. The mood pattern said to stay on alert for wild swings and CDMS took the day off. It was interesting that the pattern also implied a focus on inflation which there was.
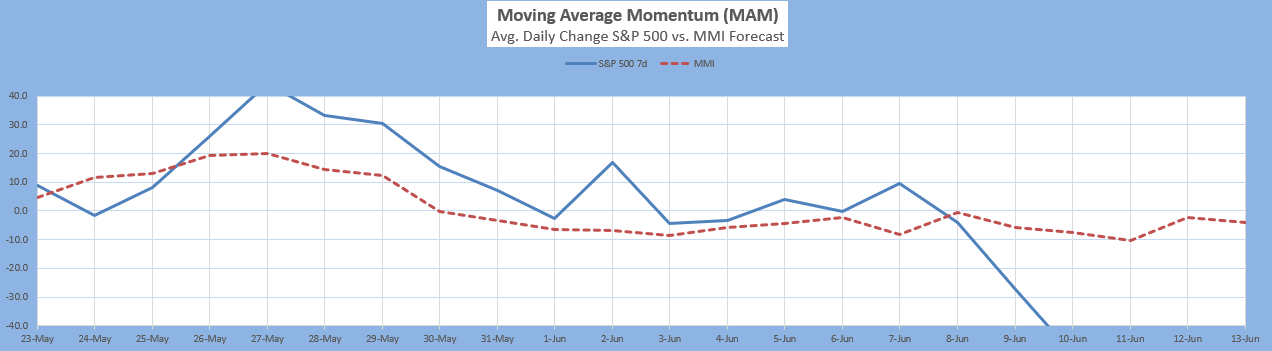
MAM is showing mega-uber-extremely oversold with building pressure for a large bounce. The last time it had this strong a reading was March 2020.
Indicator changes: MM MACD has a new swing short level as of Monday RTH open. CDMS (preliminary) is Intraday Sell for Monday.
Where We're Heading:
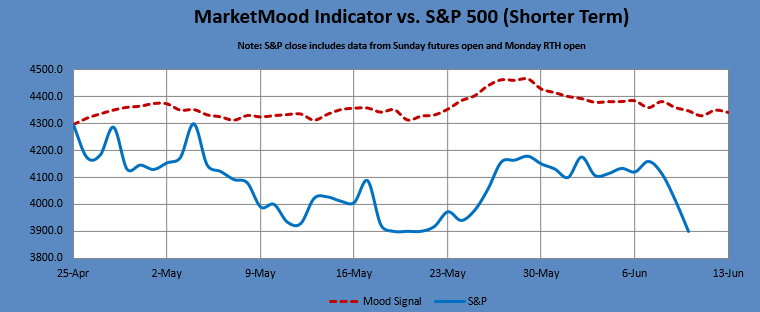
Saturday's pattern reflects a completion on some level (could we finally be done with the selling?), and also a higher risk for destructive events. There is an overall elevated risk of violence over the weekend, and tempers are likely to be running hot. MMI is mixed for the weekend, but net up for Monday RTH open. MMI is down (below open) for Monday itself.
Next 3 Days (days 2 and 3 are considered preliminary):
Date | Daily MMI | CDMS* |
6/13 (open) | Up | ---------------- |
6/13 | Down | Intraday Sell (prelim.) |
6/14 |
*Composite Daily Mood Signal (CDMS) combines the MMI daily signal and the various MM trend and trading indicators into one overall daily trade signal. Possible signals are intraday buy, daily buy, no trade, intraday sell, and daily sell. An "intraday" signal is more likely to be a mixed day, so the implied strategy is to watch for day trade setups in the indicated direction during the trading day. A "daily" signal points to less cross-currents and an implied strategy of entering at market close for the next day's trade.
TRADING STRATEGIES: Per LTTI, long term traders would be net short. Swing traders still short from Wednesday should exit should the S&P 500 open above 3897 on Monday.
Latest charts follow the summary table.
MM Indicators and Trading Parameters Summary:
Indicator | Scope | Direction |
LTTI | Longer Term Trend | Strong Bearish |
MMTT (main) | Medium Term Trend | Bullish => Bearish |
MMTT (HP) | Medium Term Trend | Bullish => Neutral |
MMTT (b/b) | Near Term bull/bear Trend Line | 4013 SPX (cash) |
MM MACD | Swing Trade | Sell < 3897 |
Note: Medium term (MMTT) is roughly 1 week to 2 months. Longer term (LTTI) is roughly 1 month to a year or more.
MMI vs. S&P 500 daily
MMI2 vs S&P 500 daily
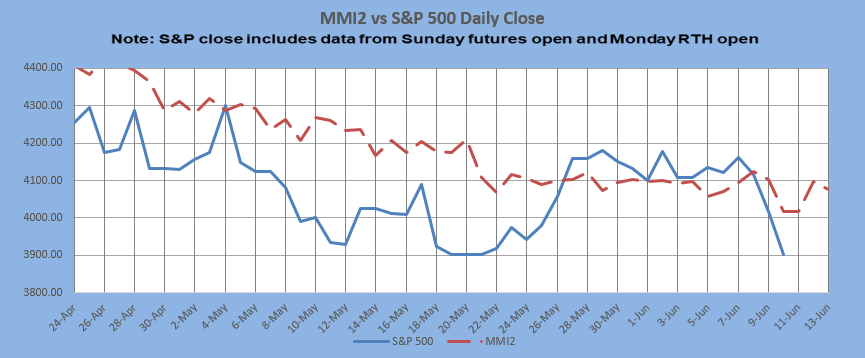
** MMI 2 uses an alternate dynamic algorithm to convert the same sentiment source data to S&P direction that the original MMI algorithm uses.
The Moving Average Momentum (MAM): The last clear MAM major low signal was Sept. 9-16, 2021. The market made a low on Sept 20, followed by a bounce and new low on Oct. 4. There was a combo major low / local high signal for Feb. 22-Mar. 21. The market made a closing low on Feb. 23, followed by a slightly lower double bottom with closing lows on Mar. 8 and Mar. 13. This double bottom, still within the timeframe, was followed by a substantial rally. The last major high signal was for Jan. 28 - Feb. 4 with the high on Feb. 2. This directly followed a previous major high signal for Dec. 21 - Dec. 31 with the actual high on Jan. 4, 2022. Both of these were followed by substantial declines.
Current status: uber-extremely oversold
Intermediate Term Forecast:
There is a possible flip in the week of June 13 which would turn a crisis/disaster pattern to "government intervention." Given that potential as well as the market not being this oversold since March 2020, bears should be on alert for a rug pull.
The monthly charts show a general downtrend with the potential for large moves in either direction through June. Since last year, our quarterly chart has been showing a sharp downtrend for Q1 through sometime in Q2 followed by a settling down somewhat through end of this year.
MM MACD signal is Sell and the trend (per MMI vs S&P 500) is Down < 3895 SPX (cash). The swing trade signal is sell below 3895.
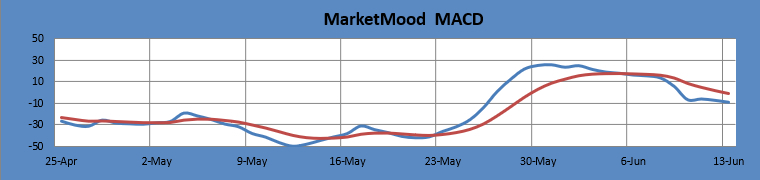
The MM MACD is similar to a standard MACD, except that it uses the MMI signal data to extend several days beyond today, while the standard MACD relies solely on historical market data.
Long Term Forecast:
The long term trend is indicated by the general divergence between the stock market and the mood generated forecast (see long term chart below). The MM Long Term Trend Indicator (bottom chart) which is derived from this divergence, indicates: "Strong Bearish Trend, hold bearish long-term positions." The MM LTTI has had this indication since 26 Apr. 2022. It was previously "bearish" from 22 Apr. 2022.
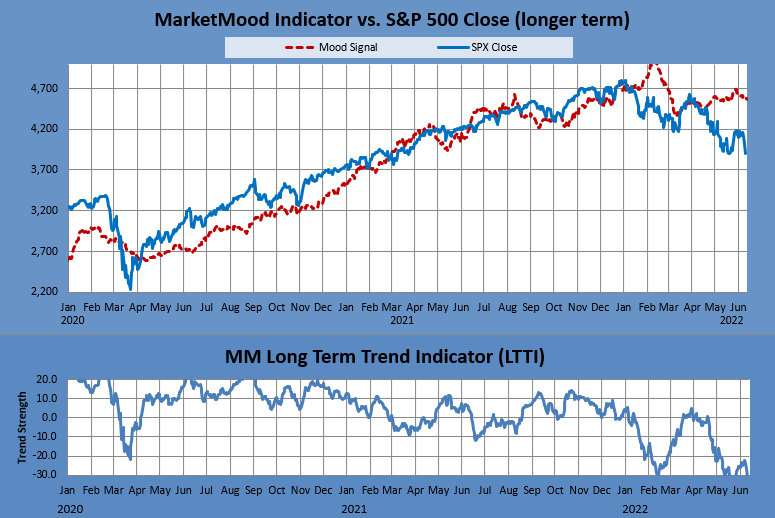
The MM LTTI measures trend strength using the divergence between the market trend and the forecast trend.
