MarketMood Weekend: Can We Get Along?
 By
By
Where We've Been:
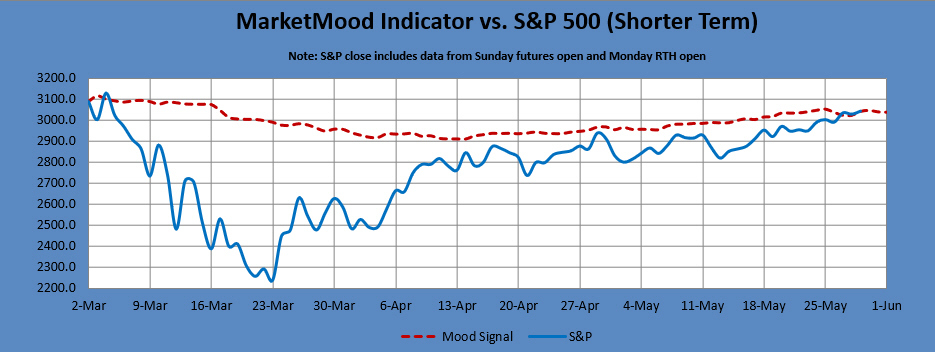
Today's mood pattern pointed to negatively perceived data, news, talk or tweets. This usually accompanies negative market movement, however MMI calculated the day as up, so I made it a no call day. The market was down most of the day, but nevertheless rallied near the end to close up for the day.
Today's trader mood context was: "financial matters, issues close to home"
Today's trader mood challenge was: "moving agendas forward"
Where We're Going
The mood pattern implies a focus on tolerance and getting along or at least moving in that direction. We'll see if the intense emotions around the country can find some (momentary) resolution. MMI is showing a mixed weekend with a net down move expected by Monday open. Monday's MMI is down (below open), however MMI2 is looking up for Monday. This gives a heads up to chop or whipsaw for Monday.
Weekend's trader mood context is: "gut instinct, shifting situations"
Weekend's trader mood challenge is: "not getting anywhere, hanging in there"
MMI Monday open: down
MarketMood Data Info:
Internet search theme MMI inputs (mood vs. effect inverted): space, vehicle, launch, disruption, entertainment, violent, protest, police, prejudice, woman, conflict, animal, man, violence
Short Term Forecast:
Next 3 Days:
| Date | Daily MMI | MMI 2* |
|---|---|---|
| 6/1 (open) | down | down |
| 6/1 | close down | up |
| 6/2 |
*MMI 2 uses an alternate dynamic algorithm to convert the same sentiment source data to S&P direction as the original MMI algorithm.
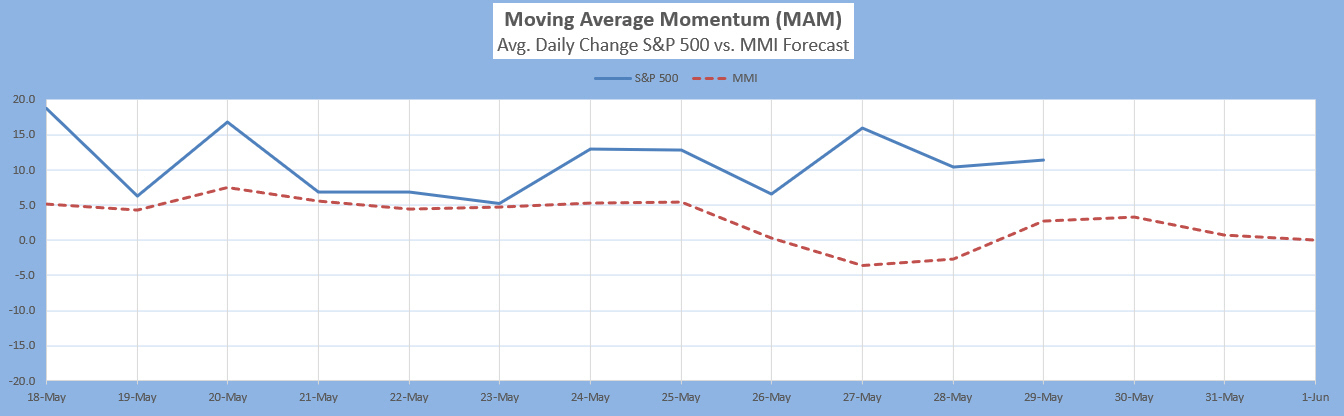
The Moving Average Momentum (MAM) Indicator's previous major low signal was 24-31 Dec., 2018. The market rallied strongly following the close on Dec. 24 which fulfilled the major low signal. The last major high signal was 8-27 Jan. 2020 (possibly the longest window ever). The closing high on 17 Jan. appeared to have fulfilled that, as the market dropped over 100 points following this window. Yet, the market quickly recovered its losses and made a new high. However, with that being the first major trend change signal in over a year, we needed to take seriously that it was pointing to something very different happening in both mood and market. The rest is history.
Current status: mildly overbought (> +10 SPX pts MAM)
Intermediate Term Forecast:
The weekly charts and momentum indicators show a local topping and pullback over the next two weeks. Weekly trend indicators show a strong bullish trend above the 2600 SPX region and neutral below that. Monthly charts point primarily up through August, yet quarterly charts show a drop into end of year. Perhaps the reconciliation of this is the nearly flat sentiment showing in the weekly charts. All together this projects a general trading environment of chop and /or whipsaw. Trends may seem to be solid, then change at a moment's notice.
MM MACD signal is unconfirmed SELL and the intermediate trend is UP. There is no swing trade signal.
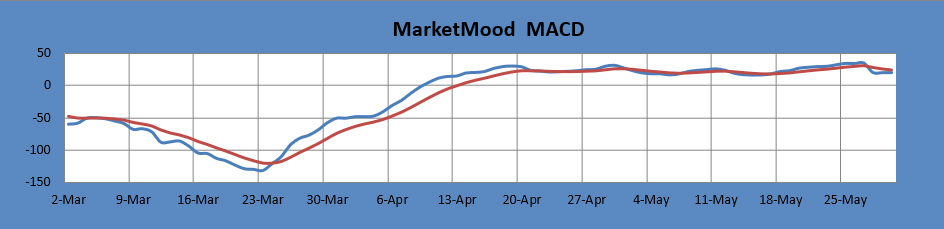
The MM MACD is similar to a standard MACD, except that it uses the MMI signal data to extend several days beyond today, while the standard MACD relies solely on historical market data.
The table below shows hypothetical trade results for strictly following the MM MACD signal vs. using the system suggested stop. Using the stop method may involve multiple trades per signal. Future results may vary.
| Date | Signal | @SPX | Signal P/L | System P/L | Net Gain Signal | Net Gain System |
| 03-Jan-20 | SELL | 3231 | ||||
| 08-Jan-20 | NEU | -48.48 | -28.73 | -48.48 | -28.73 | |
| 20-Jan-20 | SELL | 3317 | ||||
| 05-Feb-20 | NEU | -28.31 | 56.05 | -76.79 | 27.32 | |
| 12-Feb-20 | SELL | 3375 | ||||
| 27-Feb-20 | NEU | 391.74 | 212.69 | 314.95 | 389.25 | |
| 14-Apr-20 | SELL | 2778 | ||||
| 18-May-20 | NEU | -175.91 | -102.11 | 139.04 | 287.14 | |
| 27-May-20 | S/N | 2988 | -48.13 | -16 | 90.91 | 271.14 |
*indicates hypothetical trades for the current signal still in progress
Long Term Forecast:
The long term trend is indicated by the general divergence between the stock market and the mood generated forecast (see long term chart below). The MM Long Term Trend Indicator (bottom chart) which is derived from this divergence, indicates: "Bullish Trend, enter bullish long-term positions." The MM LTTI has had this indication since 22 Apr 2020. See further LTTI data below the chart.
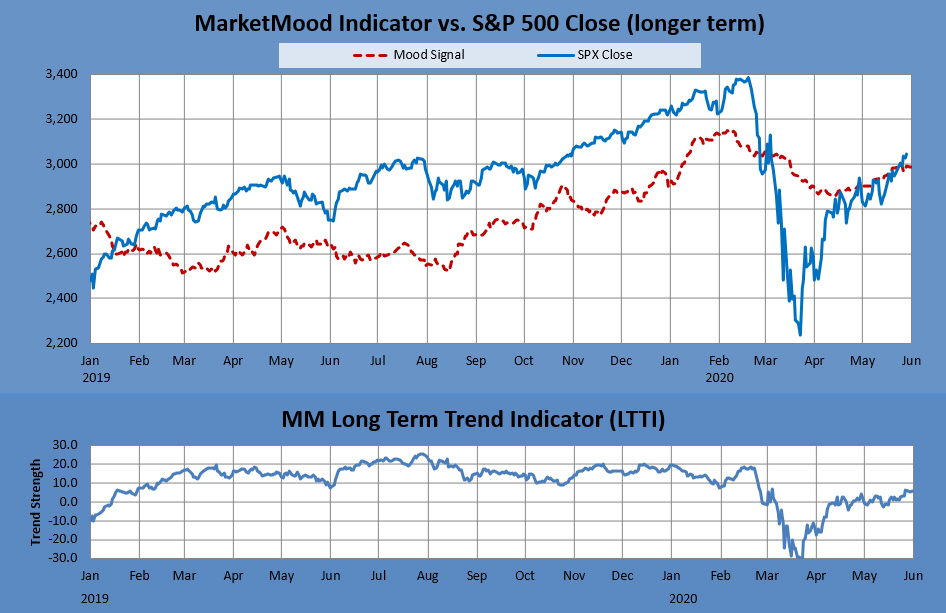
The MM LTTI measures trend strength using the divergence between the market trend and the forecast trend.
The table below provides data from the last few Long Term Trend Indicator's signals. It also compares a hypothetical trade using this indicator with the S&P 500's return during the same period. Future results may vary.
| Date | Days | Signal | SPX Close | Market pts | Points P/L | Net gain SPX | Net P/L |
| 8-Feb-19 | 1 | BUY | 2707.88 | ||||
| 10-Feb-19 | 2 | NEU | 2712.40 | 4.52 | 4.52 | 4.52 | 4.52 |
| 12-Feb-19 | 2 | BUY | 2744.73 | 33.35 | 36.85 | ||
| 31-Jan-20 | 353 | NEU | 3225.52 | 480.79 | 480.79 | 517.64 | 485.31 |
| 3-Feb-20 | 3 | BUY | 3248.92 | 23.4 | 541.04 | ||
| 25-Feb-20 | 22 | NEU | 3128.21 | -120.71 | -120.71 | 420.33 | 364.60 |
| 27-Feb-20 | 2 | SELL | 2978.76 | -149.45 | 270.88 | ||
| 2-Mar-20 | 4 | NEU | 3090.23 | 111.47 | -111.47 | 382.35 | 253.13 |
| 3-Mar-20 | 1 | SELL | 3003.37 | -86.86 | 295.49 | ||
| 4-Mar-20 | 1 | NEU | 3130.12 | 126.75 | -126.75 | 422.24 | 126.38 |
| 5-Mar-20 | 1 | SELL | 3023.94 | -106.18 | 316.06 | ||
| 10-Mar-20 | 5 | NEU | 2882.23 | -141.71 | 141.71 | 174.35 | 268.09 |
| 11-Mar-20 | 1 | SELL | 2741.38 | -140.85 | 33.50 | ||
| 6-Apr-20 | 26 | NEU | 2663.68 | -77.70 | 77.70 | -44.20 | 345.79 |
| 8-Apr-20 | 2 | BUY | 2749.98 | 86.3 | 42.10 | ||
| 21-Apr-20 | 13 | NEU | 2736.49 | -13.49 | -13.49 | 28.61 | 332.30 |
| 22-Apr-20 | 1 | BUY | 2799.31 | 62.82 | 91.43 |
MMI's recent performance relative to a long term average of over 60% correct daily up or down calls indicates how closely it's been tracking with the market near term. In the basic daily performance stats below, posted signal flip days aren't counted in the total as there is no call on those days as to a positive or negative close. Monday open does count as a call unless it's part of a flip.
Note: MMI does least well in these conditions-- 1) EW 4th wave, 2) EW b wave, 3) Diagonals, and 4) Topping. More than one of these conditions concurrently present will further diminish performance.
This week: 0/2 (0%). Up calls 0/1 (0%). Down calls 0/1 (0%).
May: 4/10 (40%). Up calls 2/5 (40%). Down calls 2/5 (40%).
YTD: 28/53 (53%)
Conclusion: market tracking with sentiment on a day by day basis has been running below average so far this year. Most recently, it's been tracking below the average for the current year's performance.
Note: Changes to next day MMI signals occur about 5% of the time, and will be announced in updates as well as the daily report should they occur. Same day signals will not change. Day 2 and 3 signals reflect the most current information, and are subject to change. The default trade per the daily signals is executed at market on close. except on Mondays, as there is a signal for Monday open (i.e. "weekend close") and Monday close. The daily MMI signals are correct as daily direction calls about 63% of the time. Please manage your trading risk accordingly.
