MarketMood Weekend: Calm Before the Storm
 By
By
Where We've Been:
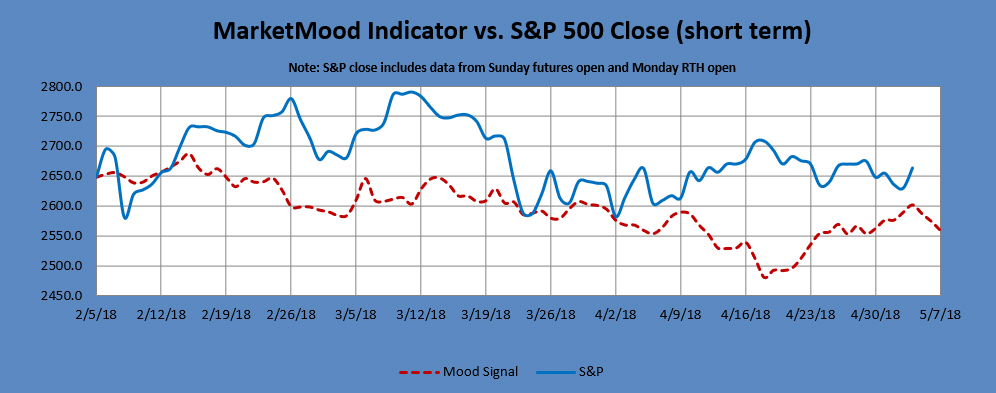
The mood pattern for Friday continued Thursday's "bad news" (news, facts, or data perceived as negative) motif, but MMI gave the odds to the upside with the currently inverted mood vs. effect. The unemployment report was disappointing, but after digesting it, the market decided it was a good day to rally regardless.
MMI for Friday was: close up; S&P 500 closed +1.28%
Where We're Heading:
The weekend mood pattern (Monday open) is one of an "eerie quiet" or calm before the storm. It has no direction of its own, but MMI gives the odds to the downside in opposition to Friday's rally. Nevertheless, it may be premature to get too aggressively short. FWIW, there is a component that can accompany a background of violence or explosiveness in the news (which could also include more Hawaii volcano news).
MMI for Monday open: down
MarketMood Data Info:
Internet search theme MMI inputs (mood vs. effect currently inverted): men, sports, winners, video game, business, rap music, controversy, star, history, honor, international, inventor, film, art
Short Term Forecast:
Next 3 Days:
| Date | Daily MMI |
|---|---|
| 5/7 (open) | down |
| 5/7 | close down |
| 5/8 |
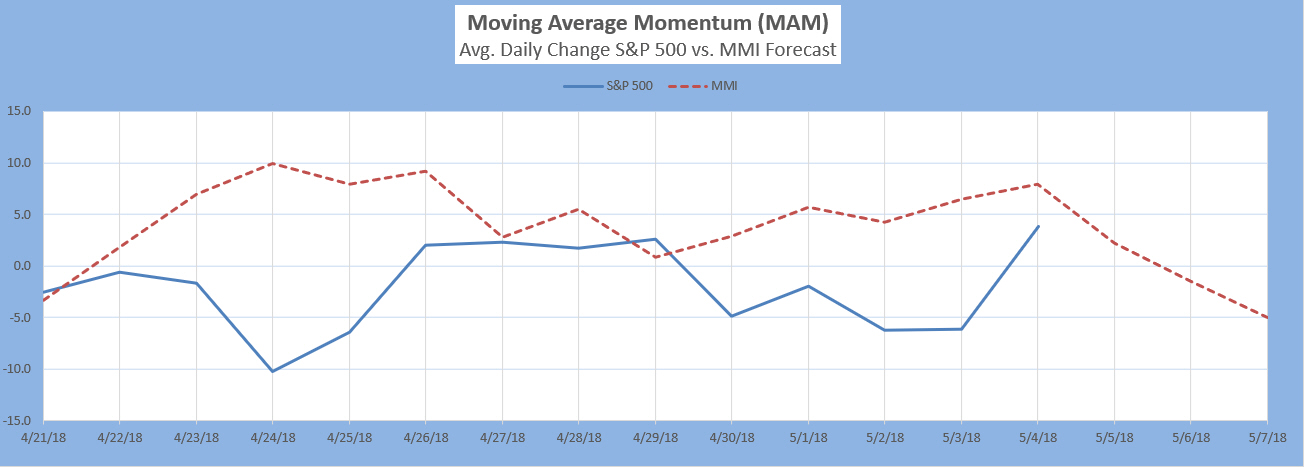
The Moving Average Momentum (MAM) Indicator last signaled a major trend change with a significant LOW indication between April 18-25.
Note: Changes to next day MMI signals occur about 5% of the time, and will be announced in updates as well as the daily report should they occur. Same day signals will not change. Day 2 and 3 signals reflect the most current information, and are subject to change. The default trade per the daily signals is executed at market on close. except on Mondays, as there is a signal for Monday open (i.e. "weekend close") and Monday close. The daily MMI signals are correct as daily direction calls about 63% of the time. Please manage your trading risk accordingly.
Intermediate Term Forecast:
The primary outlook is that a countertrend corrective move is in progress. The weekly charts show a choppy / whipsaw filled bearish correction still in progress for at least another few weeks. The monthly charts show a choppy almost sideways motion with April as an interim high (monthly closing basis), and May as a next low.
MM MACD signal is BUY, and the intermediate trend is UP. The trade signal is hold long positions; add to longs at or above 2667 SPX.
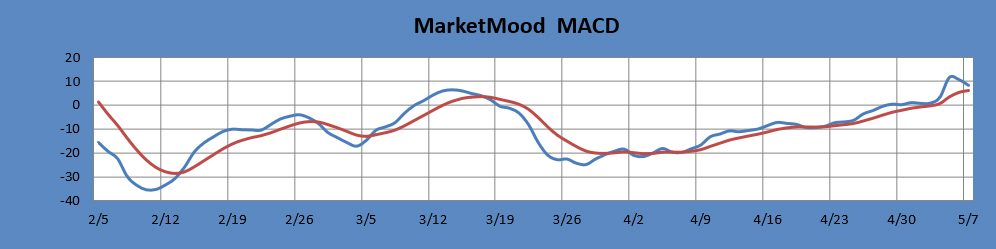
The MM MACD is similar to a standard MACD, except that it uses the MMI signal data to extend several days beyond today, while the standard MACD relies solely on historical market data.
Long Term Forecast:
The long term forecast remains strongly bullish. The bullish long term trend is indicated by the generally positive divergence between the stock market and the mood generated forecast (see long term chart below). The MM Long Term Trend Indicator (bottom chart) which is derived from this divergence, indicates: Bullish Trend, hold long positions. The MM LTTI has had this same bullish indication since 12 Sept., 2016.
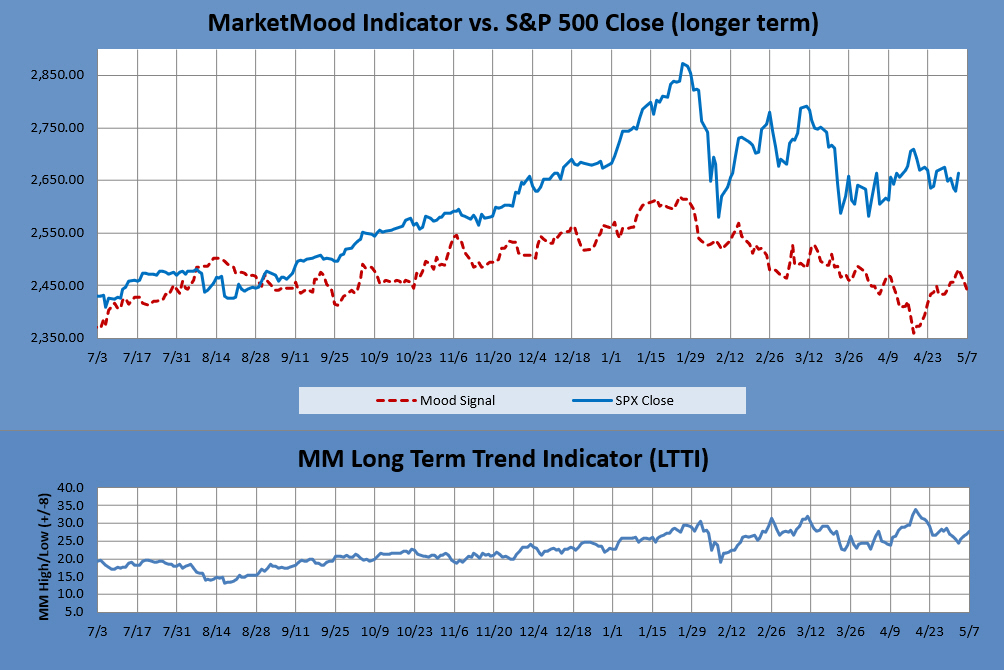
The MM LTTI measures trend strength using the divergence between the market trend and the forecast trend. A move above +8 or below -8 is bullish or bearish respectively. A value over 10 or under -10 followed by a move back through +/-8 signals a high or low is likely in. A subsequent move below +5 (or above-5) signals a trend change to bearish (or bullish).
