MarketMood Wednesday: Somebody Fix This!
Where We've Been:
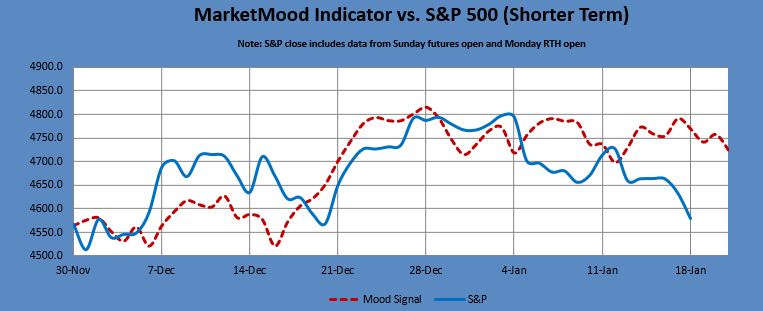
Today's mood pattern reflected "continuation" and we were looking for a clue from today's open to see how the market might want to continue. Futures were trying to bounce just before Regular Trading Hours open, but since it wasn't a clear and obvious bounce we assumed a generic down RTH open. With that, the Market Mood Indicator (MMI) was down (below open) for today, our daily trade signal or composite daily mood signal (CDMS) turned to strong sell and the MM MACD remained in swing sell mode. The market closed strongly down.
Where We're Heading:
People are feeling restless and tired of restrictions and shutdowns and the mood reflects a need for action. There's an elevated risk over the next few days that a person or group may go to extreme measures to express their frustrations. MMI is down for Wednesday, up for Thursday and down for Friday. Pressure is building for a strong bounce, but bulls have not yet shown any resolve.
MM Trend Trader remains full on bearish. MM MACD is getting close to giving up on its swing sell, but hasn't just yet and remains a swing sell below 4655 SPX cash. A solid move back above the bull / bear trendline (4643 SPX tomorrow) should have bears take notice and reconsider their positions. Until then, bears are in full control.
Internet search theme source data for MMI inputs: men, sports, losers, winner, championship, schedule, volcano, flood, island, nature, snow, wind, warning, hostage, religion, building, death, police
Next 3 Days (days 2 and 3 are considered preliminary):
Date | Daily MMI | CDMS* |
1/19 | Down | Sell |
1/20 | Up | No Trade |
1/21 | Down | Strong Sell (prelim.) |
*Composite Daily Mood Signal (CDMS) combines the MMI daily signal and the various MM trend and trading indicators into one overall daily trade signal. Possible signals are buy, strong buy, no trade, sell, and strong sell. A "strong" signal implies a higher probability of success rather than necessarily a larger point move.
Latest charts follow the summary table.
MM Indicators and Trading Parameters Summary:
Indicator | Scope | Direction |
LTTI | Longer Term Trend | Bearish |
MMTT (main) | Medium Term Trend | Bearish |
MMTT (HP) | Medium Term Trend | Bearish |
MMTT (b/b) | Near Term bull/bear Trend Line | 4643 SPX (cash) |
MM MACD | Swing Trade | Sell < 4655 |
Note: Medium term is roughly 1 week to 2 months. Longer term is roughly 1 month to a year or more.
MMI vs. S&P 500 daily
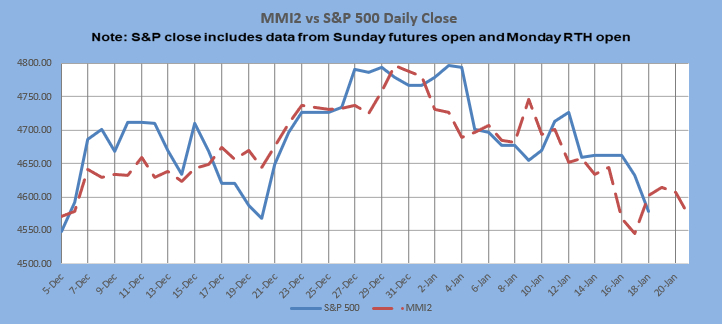
MMI2 vs S&P 500 daily
** MMI 2 uses an alternate dynamic algorithm to convert the same sentiment source data to S&P direction that the original MMI algorithm uses.
The Moving Average Momentum (MAM): The last MAM major low signal was Sept. 9-16, 2021. The market made a low on Sept 20, followed by a bounce and new low on Oct. 4. The latest major high signal was Dec. 21 - Dec. 31. The current pullback began with the high on Jan. 4, 2022. The last prior major high signal was Oct. 25 - Nov. 14, 2021 with the actual closing high one week outside of the range at Nov. 21.
Current status: highly oversold
Intermediate Term Forecast:
The longer term and intermediate trends are both bearish at this time. The MAM major high signal implied a substantial pullback was imminent with the highest probability between Dec. 21-31 2021, and it appears to have begun on Jan. 4.
MarketMood Trend Trader
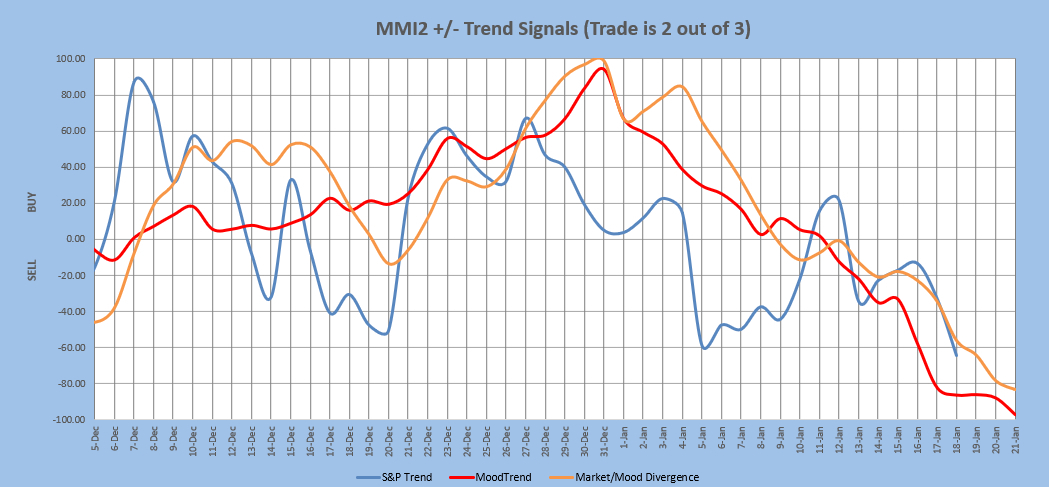
The chart below uses three sentiment trend lines to generate a swing trade signal of BUY if 2 out of 3 are greater than 0 and SELL if 2 out of 3 are less than 0. Trade length averages 9 days, but can be as short as 1 and has been as long as 60. The signal is updated each day after market close. Back-testing shows this signal averaging about 12 SPX points per trade over the last few years. Back-testing a higher probability signal derived only from the two mood related trend lines averages 33 SPX points per trade, but only initiates trades about once every 3 weeks. Note: past performance does not guarantee future results.
Current signal: Sell since 12 Jan. HP signal: Sell since 12 Jan.
MM MACD signal is Sell and the trend (per MMI vs S&P 500) is Down < 4655 SPX cash. The swing trade signal is sell < 4655.
The MM MACD is similar to a standard MACD, except that it uses the MMI signal data to extend several days beyond today, while the standard MACD relies solely on historical market data.
Long Term Forecast:
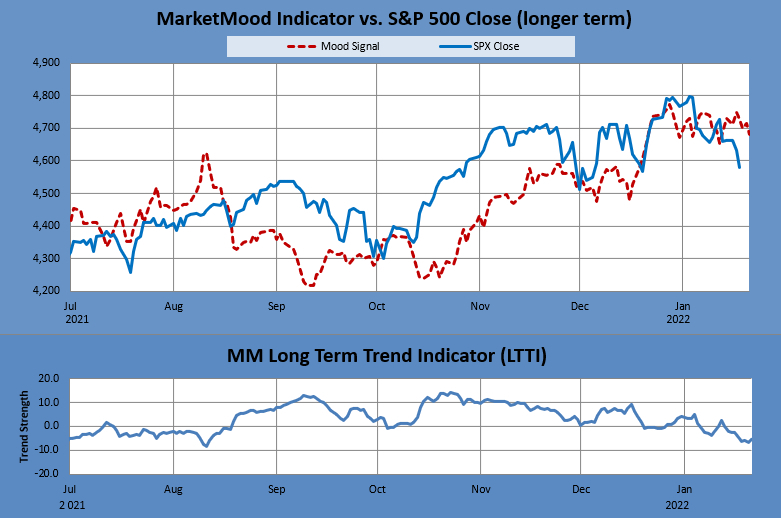
The long term trend is indicated by the general divergence between the stock market and the mood generated forecast (see long term chart below). The MM Long Term Trend Indicator (bottom chart) which is derived from this divergence, indicates: "Bearish Trend, enter/hold short long-term positions." The MM LTTI has had this indication since 18 Jan. 2022. Previously, it was "Early Bearish Trend" from 5 Jan. 2022.
The MM LTTI measures trend strength using the divergence between the market trend and the forecast trend.


