MarketMood Wednesday: Getting Serious
 By
By
Where We've Been:
Tuesday was day one of a two day pattern that often accompanies violence and/or volatility. This is a pattern that is often associated with protests and sometimes with terrorist activity or "random" acts of violence the same or next day. MMI gives the odds to the downside.
MMI for Tuesday was: close down; S&P 500 closed +0.07%.
Where We're Heading:
Wednesday is day two of a two day pattern that often accompanies violence and/or volatility. It's a pattern that is often associated with protests and sometimes with terrorist activity or "random" acts of violence the same or next day. Because MMI calculates each day one at a time, it does not see this two day pattern, and is looking at Wednesday as a "calm before the storm" pattern, and giving the odds to the upside. The overall mood pattern through the end of the week, looks to me like something really intense is getting ready to show up.
Note: sometimes when there is a market external event related to the violent/volatile mood pattern (e.g. unexpected violence), the market will recover shortly afterwords.
MMI for Wednesday: close up (caution advised)
MarketMood Data Info:
Internet search theme MMI inputs (mood vs. effect currently inverted): men, sports, winners
Short Term Forecast:
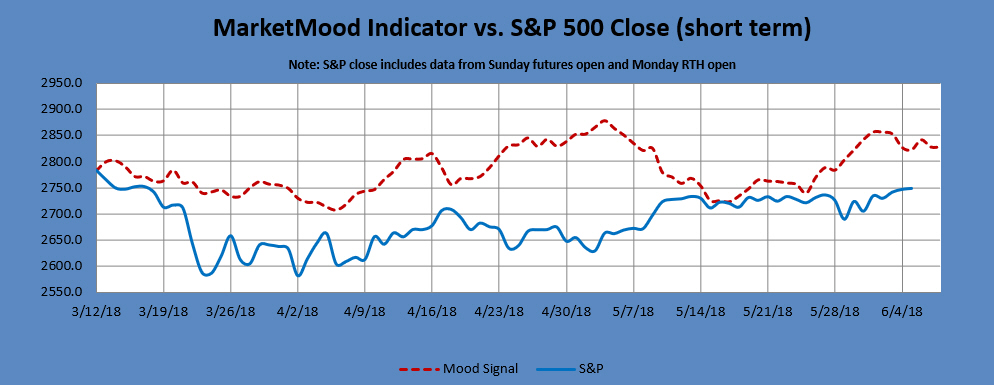
Next 3 Days:
| Date | Daily MMI |
|---|---|
| 6/6 | close up (caution advised) |
| 6/7 | close down |
| 6/8 | close up |
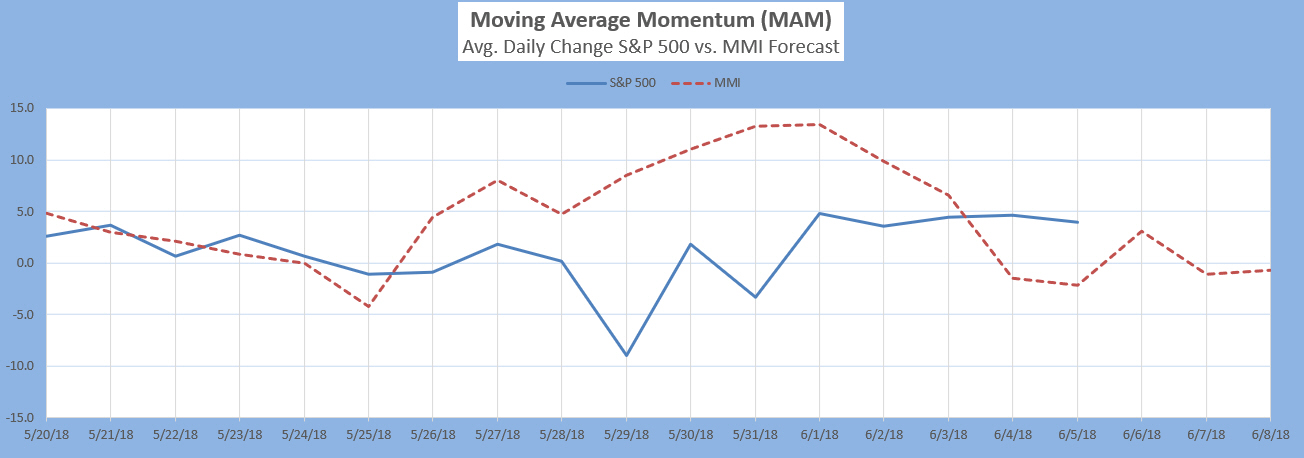
The Moving Average Momentum (MAM) Indicator last signaled a major trend change with a major LOW indication between April 18-25. The MAM signaled an important trend change May 30 - June 8 (it still hasn't specified a particular direction). I'm starting to wonder if "no particular direction" is indicative of diagonals, as that seems to be a pattern.
Note: Changes to next day MMI signals occur about 5% of the time, and will be announced in updates as well as the daily report should they occur. Same day signals will not change. Day 2 and 3 signals reflect the most current information, and are subject to change. The default trade per the daily signals is executed at market on close. except on Mondays, as there is a signal for Monday open (i.e. "weekend close") and Monday close. The daily MMI signals are correct as daily direction calls about 63% of the time. Please manage your trading risk accordingly.
Intermediate Term Forecast:
The primary outlook is that a countertrend corrective move is in progress. Monthly charts show a low in July.
MM MACD signal is unconfirmed BUY, and the intermediate trend is DOWN. The trade signal is N/A.
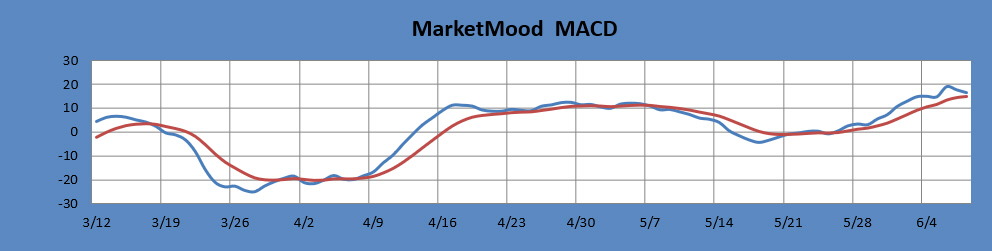
The MM MACD is similar to a standard MACD, except that it uses the MMI signal data to extend several days beyond today, while the standard MACD relies solely on historical market data.
Long Term Forecast:
The long term forecast remains strongly bullish. The bullish long term trend is indicated by the generally positive divergence between the stock market and the mood generated forecast (see long term chart below). The MM Long Term Trend Indicator (bottom chart) which is derived from this divergence, indicates: Bullish Trend, hold long positions. The MM LTTI has had this same bullish indication since 12 Sept., 2016.
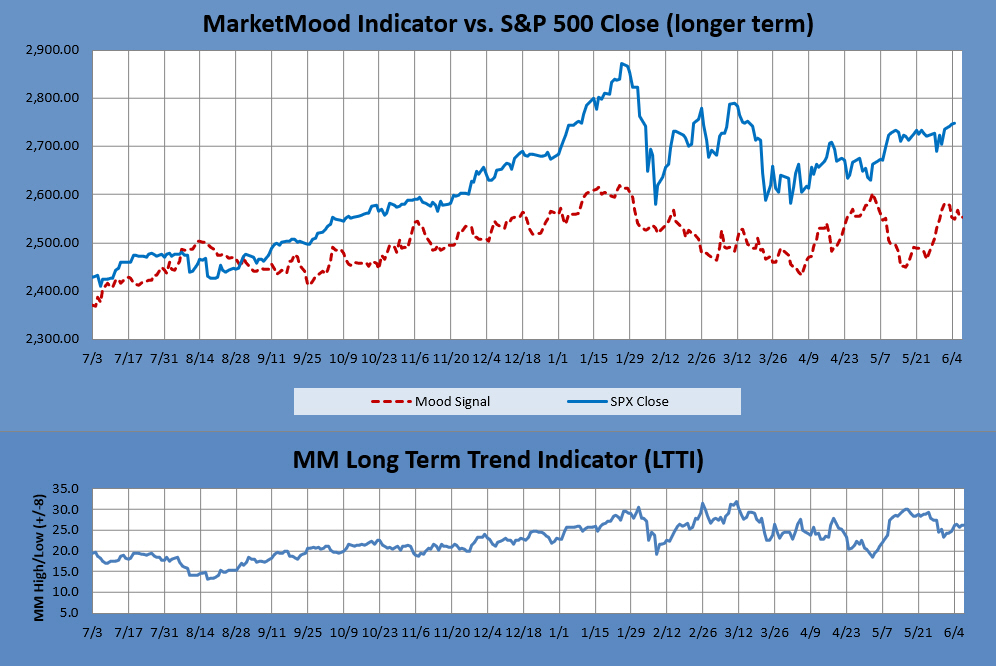
The MM LTTI measures trend strength using the divergence between the market trend and the forecast trend. A move above +8 or below -8 is bullish or bearish respectively. A value over 10 or under -10 followed by a move back through +/-8 signals a high or low is likely in. A subsequent move below +5 (or above-5) signals a trend change to bearish (or bullish).
