MarketMood Wednesday: Clues from the News
 By
By
Where We've Been:
Today's mood pattern of "bullish exhaustion" often takes place at local highs. We seemed to have touched one today. The pattern also implies that through Wednesday would be a good time to watch for potential international / geopolitical developments in the news cycle. Europe's Covid-19 situation was deemed to be connected to today's market losses by the media. Also of possible interest is the Israeli election results still to be determined.
Where We're Heading:
Tomorrow's mood pattern implies "clarity" as well as a focus on news, data, or facts. Perhaps questions will be answered and ambiguity will turn to clarity tomorrow in the markets as well. Unfortunately, MMI has no call for tomorrow's market direction. MMI is down for Thursday and Friday. MM Trend Trader continues to be bullish or bearish depending which side of the near term bull/bear trend line the market finds itself.
There is a confirmed MAM major high signal in place. The primary window for this high is March 10-March 17. There is a slightly less probable secondary window for this high for March 17-24. This signal results from both mood and market being sufficiently bullish that a major high is now considered imminent (or has recently already occurred). Remember, only the market can confirm that a lasting pullback has begun, and we'll only know for certain looking back from the rear-view mirror down the road. We will continue to watch what the market is telling us as our secondary window finishes up tomorrow.
Internet search theme source data for MMI inputs: nature, calendar, spring
Next 3 Days:
| Date | Daily MMI | MMI 2* |
| 3/24 | ? | down |
| 3/25 | down | up |
| 3/26 | down | down |
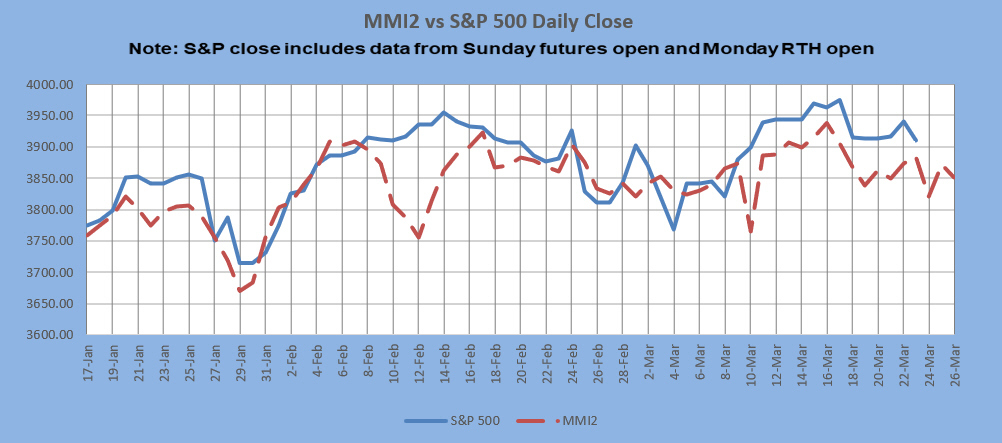
*MMI 2 uses an alternate dynamic algorithm to convert the same sentiment source data to S&P direction as the original MMI algorithm.
MM Indicators and Trading Parameters Summary:
| Indicator | Scope | Direction |
| LTTI | Longer Term Trend | Bullish |
| MMTT (main) | Medium Term Trend | Bearish < 3924 SPX (bullish > 3924) |
| MMTT (HP) | Medium Term Trend | Neutral / No Trade |
| MMTT (b/b) | Near Term bull/bear Trend Line | 3924 SPX |
| MM MACD | Swing Trade | Neutral / Exit swing longs |
| MMI | Next calculated daily sentiment bias | ? |
Note: Medium term is roughly 1 week to 2 months. Longer term is roughly 1 month to 1 year.
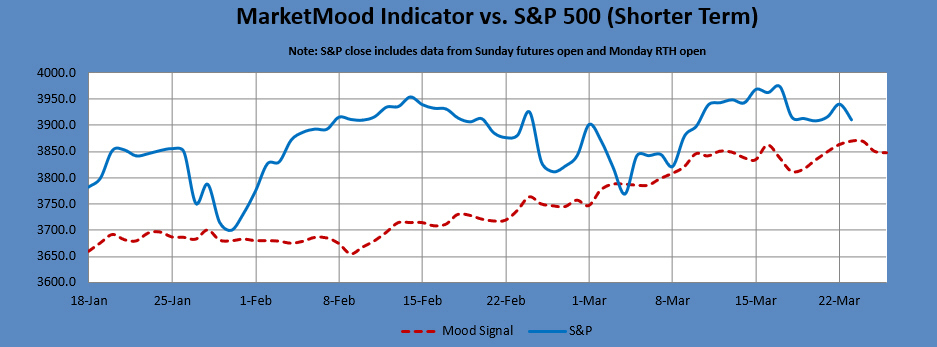
Shorter Term MarketMood Indicator vs. S&P 500 Charts:
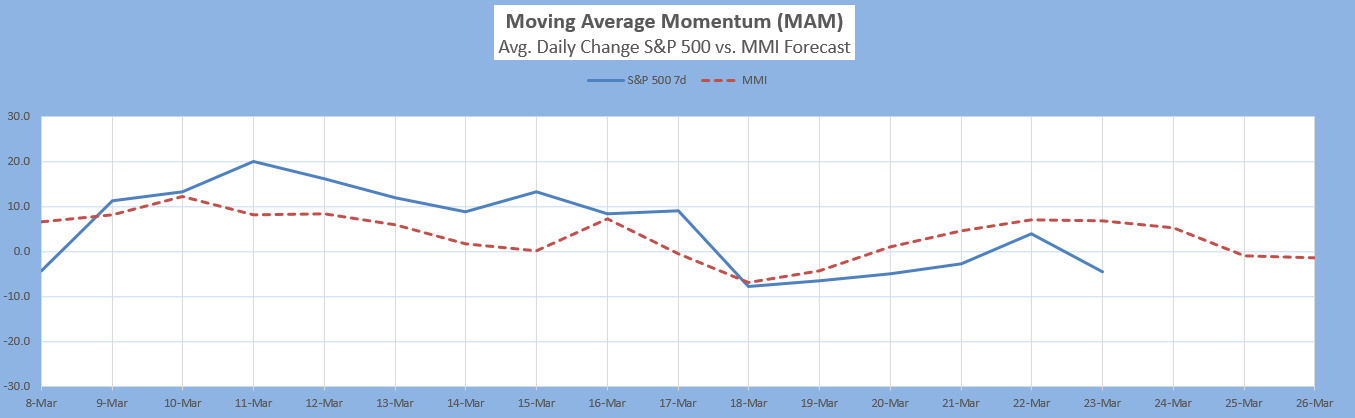
The Moving Average Momentum (MAM): It's been quite a long time since there was a normal major high or low signal. the indicator's last major low signal was 24-31 Dec., 2018. The market rallied strongly following the close on Dec. 24 which fulfilled the major low signal. There was an ambiguous low signal from 20-27 Mar. 2020. It was a combo major low and minor high in the same region. The market did make a substantial low in that time-frame. The last major high signal was 8-27 Jan. 2020 (possibly the longest window ever). The closing high in that window was 3330 on the 17th then again 3326 on the 23rd. The S&P 500 dropped about 100 points from there through end of month, which was the largest drop in some time. The market then rallied through February 19th to 3386, 60 points above the last high. That was the actual high point, about 3 weeks past this 3 week window. It most definitely was a major high point as it was followed by a steep drop of almost 1000 points before a closing low on March 23, 2020.
There is a confirmed MAM major high signal in place. The primary window for this high is March 10-March 17. There is a slightly less probable secondary window for this high for March 17-24. This signal results from both mood and market being sufficiently bullish that a major high is now considered imminent (or has recently already occurred).
Current status: neutral
Intermediate Term Forecast:
There are two primary scenarios for April-May depending on how March finishes up. The base case is for the current decline to bottom and then for a continuation up to a high in March. The alt case would be for a failed rally down to a low in March. The weekly outlook shows a stimulus induced bullish tilt for approximately March 17-22. Other than that it's ambiguous in the near term. More details are available in the March Big Picture Update video.
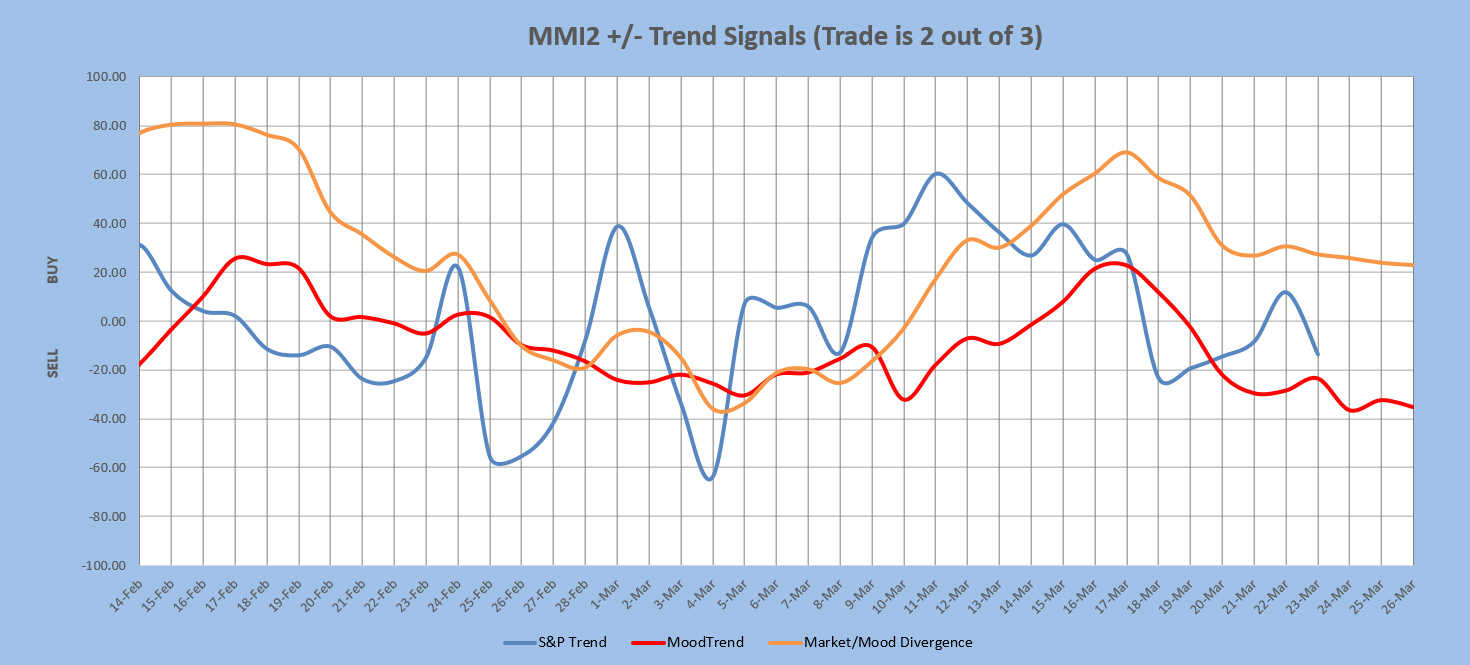
MarketMood Trend Trader
The chart below uses three sentiment trend lines to generate a swing trade signal of BUY if 2 out of 3 are greater than 0 and SELL if 2 out of 3 are less than 0. Trade length averages 9 days, but can be as short as 1 and has been as long as 60. The signal is updated each day after market close. Back-testing shows this signal averaging about 12 SPX points per trade over the last few years. Back-testing a higher probability signal derived only from the two mood related trend lines averages 33 SPX points per trade, but only initiates trades about once every 3 weeks. Note: past performance does not guarantee future results.
Current signal: SELL since 23 Mar. HP signal: Neutral/No Trade since 19 Mar.
MM MACD signal is NEUTRAL and the intermediate trend is bullish > 3874. There is no swing trade
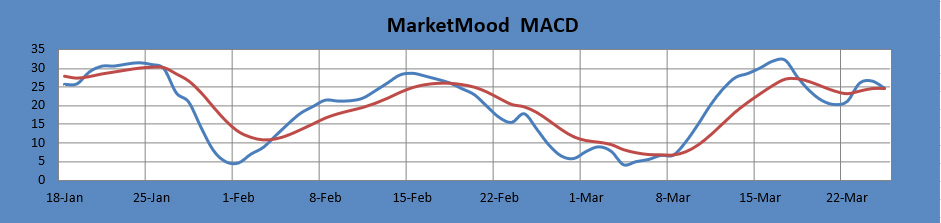
The MM MACD is similar to a standard MACD, except that it uses the MMI signal data to extend several days beyond today, while the standard MACD relies solely on historical market data.
Long Term Forecast:
The long term trend is indicated by the general divergence between the stock market and the mood generated forecast (see long term chart below). The MM Long Term Trend Indicator (bottom chart) which is derived from this divergence, indicates: "Bullish Trend, hold long long-term positions." The MM LTTI has had this indication since 4 Nov 2020.
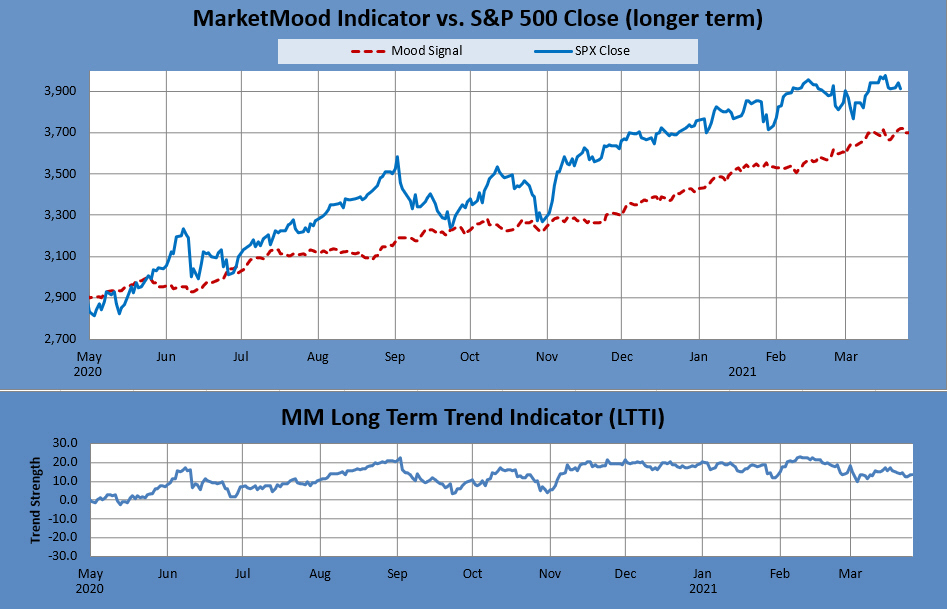
The MM LTTI measures trend strength using the divergence between the market trend and the forecast trend.
For the Extremely Curious:
In normal mode, the top of the mood chart is primary, and in inverted mode the bottom of the chart is. Normal mode is currently in effect.
Tomorrow's market mood and news themes: clarity, data, facts
Tomorrow's trader context is: pushing agendas forward, far-away
Limitations:
MMI does least well in these conditions-- 1) EW 4th wave, 2) EW b wave, 3) Diagonals, and 4) Topping. More than one of these conditions concurrently present will further diminish performance.
Note: Changes to next day MMI signals occur about 5% of the time, and will be announced in updates as well as the daily report should they occur. Same day signals will not change. Day 2 and 3 signals reflect the most current information, and are subject to change. The default trade per the daily signals is executed at market on close. except on Mondays, as there is a signal for Monday open (i.e. "weekend close") and Monday close. Historical data implies that the daily MMI signals tend to be correct as daily direction calls about 63% of the time over the long term.
