MarketMood Wednesday: An Emotional Moment
 By
By
Where We've Been:
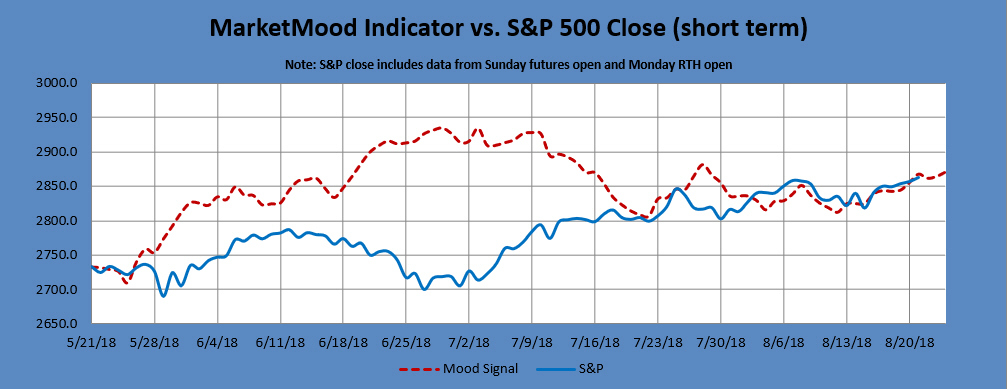
Tuesday's mood pattern combined a bullish trend component with one associated with volatility. It also contained a component associated with completion. Combining this with the leftovers of Sunday-Monday's "sudden change" pattern, bulls were on notice that a near term change of trend was coming up fairly soon.
Markets were up most of the day, and the S&P 500 made a new all time high. At the end of the day and after hours markets retreated (our sudden change motif) as headlines about Manafort and Cohen broke. We also got a double hit with volatility (e.g. VXX) ending up, in spite of the positive close.
MMI for Tuesday was: close up (caution advised); S&P 500 closed +0.21%
Where We're Heading:
Wednesday's mood pattern points to strong emotions. This could include passionate outcries, and possibly a minor panic in the markets. We were watching for a near term pullback this week, and this may be it but there are no strongly bearish indications in any of our derivative indicators at this time.
MMI for Wednesday: close down
MarketMood Data Info:
Internet search theme MMI inputs: man, music, engagement, race, sports, winner
Short Term Forecast:
Next 3 Days:
| Date | Daily MMI |
|---|---|
| 8/22 | close down |
| 8/23 | close up |
| 8/24 | close up |
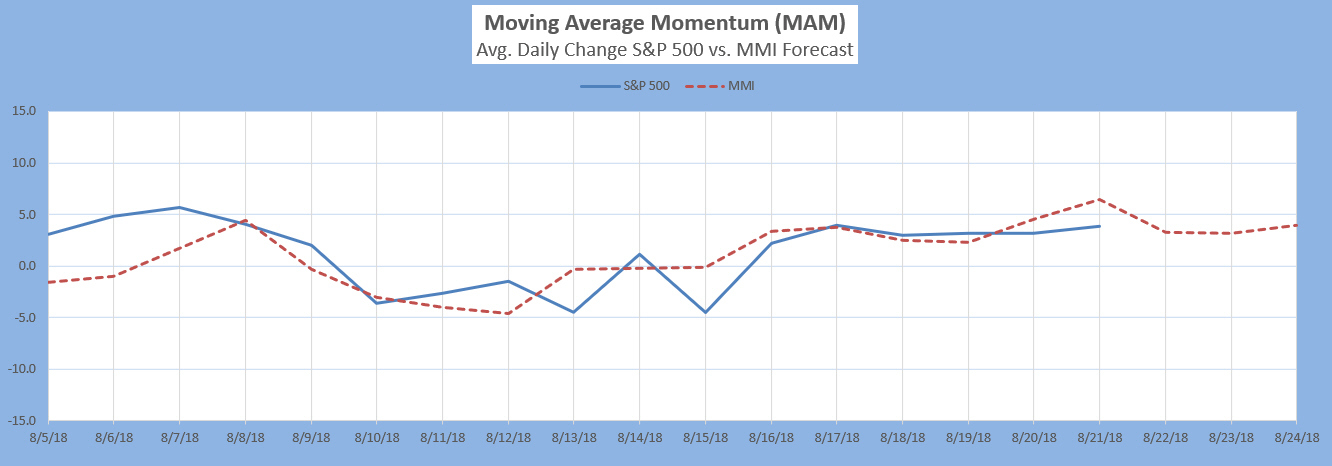
The Moving Average Momentum (MAM) Indicator last signaled a major trend change with a major LOW indication between April 18-25 (there was a closing low on the 25th which repeated slightly lower on May 3-- a major low).
The last few MAM signals (significant trend change, no direction specified) have only confirmed that the current move in the S&P is most likely an Elliott Wave diagonal.
Note: Changes to next day MMI signals occur about 5% of the time, and will be announced in updates as well as the daily report should they occur. Same day signals will not change. Day 2 and 3 signals reflect the most current information, and are subject to change. The default trade per the daily signals is executed at market on close. except on Mondays, as there is a signal for Monday open (i.e. "weekend close") and Monday close. The daily MMI signals are correct as daily direction calls about 63% of the time. Please manage your trading risk accordingly.
Intermediate Term Forecast:
The primary outlook is that a corrective move is in progress. Weekly charts are looking for a near term top or pause. Monthly charts show (roughly) August as a high and October as a low.
MM MACD signal is unconfirmed BUY, and the intermediate trend is DOWN. There is no swing trade signal.
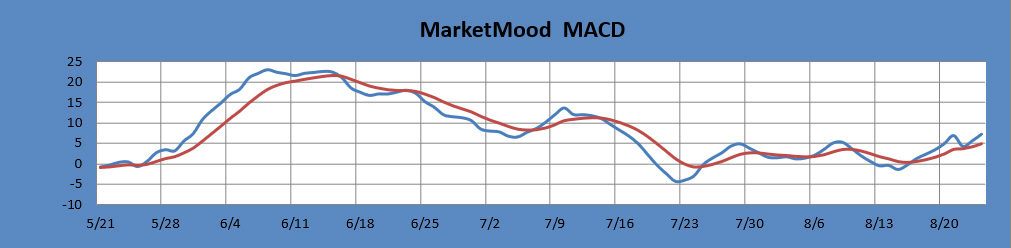
The MM MACD is similar to a standard MACD, except that it uses the MMI signal data to extend several days beyond today, while the standard MACD relies solely on historical market data.
Long Term Forecast:
The long term forecast remains strongly bullish. The bullish long term trend is indicated by the generally positive divergence between the stock market and the mood generated forecast (see long term chart below). The MM Long Term Trend Indicator (bottom chart) which is derived from this divergence, indicates: Bullish Trend, hold long positions. The MM LTTI has had this same bullish indication since 12 Sept., 2016.
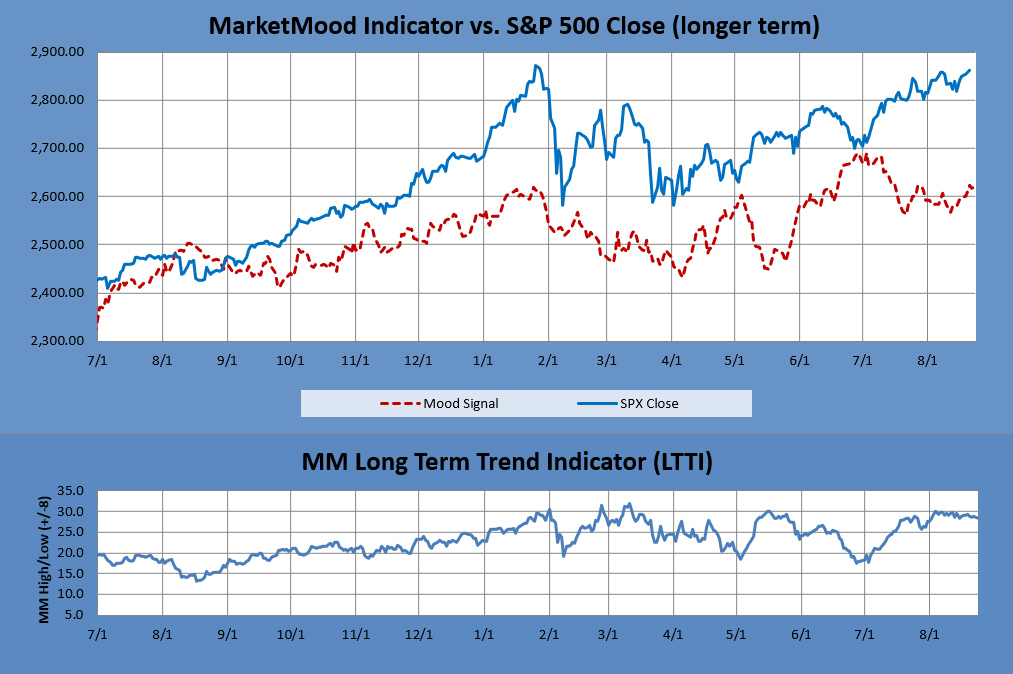
The MM LTTI measures trend strength using the divergence between the market trend and the forecast trend. A move above +8 or below -8 is bullish or bearish respectively. A value over 10 or under -10 followed by a move back through +/-8 signals a high or low is likely in. A subsequent move below +5 (or above-5) signals a trend change to bearish (or bullish).
