MarketMood Tuesday: More Confusion
 By
By
Where We've Been:
The long weekend's mood pattern is undefined, so there is no specific information for Tuesday open. The sharp drop alert remains in effect on a weekly scale, and on a daily scale surrounding this long weekend. The LTTI still reads "topping in progress."
MMI for Tuesday open: uncertain
Where We're Heading:
Tuesday's mood pattern reflects confusion or uncertainty. MMI for Tuesday is the same direction as the market opens relative to Friday's close. A sharp drop alert remains in effect. The LTTI still reads "topping in progress" with no sign of a change as of yet.
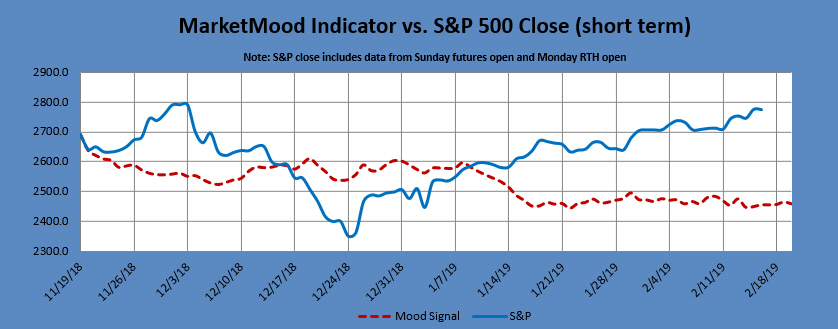
Sharp drop alert: Conditions are present in both the daily and weekly chart for sharp drop alerts. The odds for this are heightened between Friday and Monday per the daily chart which is exceptionally flat during that period (see first chart below).
MMI for Tuesday: close same direction as market opens.
MarketMood Data Info:
Internet search theme MMI inputs: shooting, injury, death, man, president, speech, emergency, international
Short Term Forecast:
Next 3 Days:
| Date | Daily MMI |
|---|---|
| 2/19 (open) | ? |
| 2/19 | same as 2/19 open |
| 2/20 | close down |
Note: Changes to next day MMI signals occur about 5% of the time, and will be announced in updates as well as the daily report should they occur. Same day signals will not change. Day 2 and 3 signals reflect the most current information, and are subject to change. The default trade per the daily signals is executed at market on close. except on Mondays, as there is a signal for Monday open (i.e. "weekend close") and Monday close. The daily MMI signals are correct as daily direction calls about 63% of the time. Please manage your trading risk accordingly.
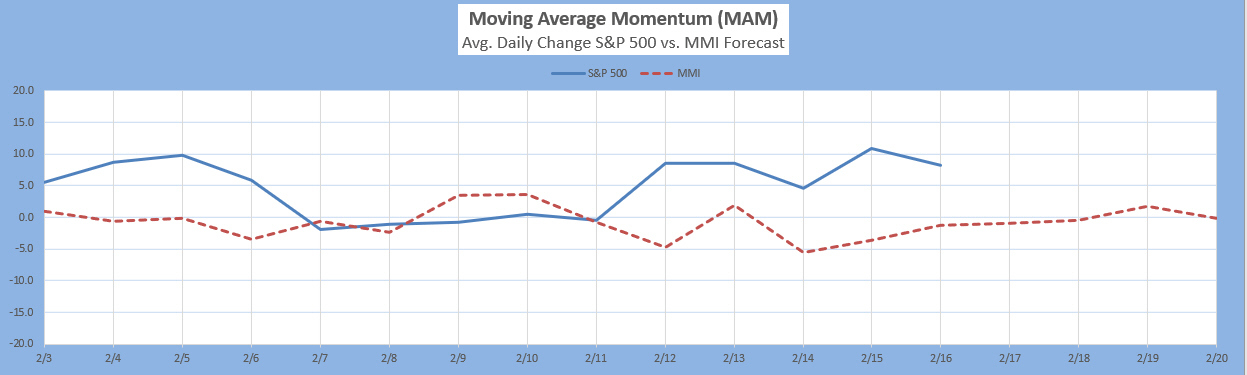
The Moving Average Momentum (MAM) Indicator's last major high signal was 11/1-9. The closing high on 11/7 fulfilled that. The last major low signal was 12/24-31. The market rallied strongly after the close on Dec. 24 which fulfilled the major low signal.
Intermediate Term Forecast:
The primary outlook is that a corrective move is in progress. Weekly charts imply a narrow window for a pullback (about a week or two) before market goes higher. Monthly charts show the market to be primarily in a corrective mostly downward move through March then turning up. A next low is anticipated February/March.
MM MACD signal is unconfirmed SELL and the intermediate trend is UP. There is no swing trade signal.
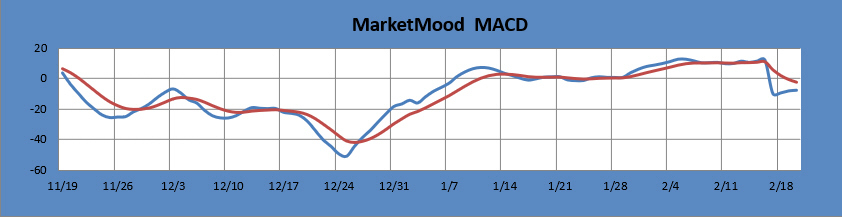
The MM MACD is similar to a standard MACD, except that it uses the MMI signal data to extend several days beyond today, while the standard MACD relies solely on historical market data.
Long Term Forecast:
The long term forecast has returned to bullish from neutral and issued a "topping in progress" signal. A stock market bottom was confirmed by the last long term low signal on 12/26/18. The next time LTTI turns neutral it will issue a "top likely in place" signal. Since a nearly two year bullish trend has recently completed, the trend may continue to vacillate between bearish, neutral and bullish for a bit before firmly deciding on the next solid long term trend (the hallmarks of a corrective wave pattern). The long term trend is indicated by the general divergence between the stock market and the mood generated forecast (see long term chart below). The MM Long Term Trend Indicator (bottom chart) which is derived from this divergence, indicates: Bullish Trend. The MM LTTI has had this indication since 12 Feb., 2019.
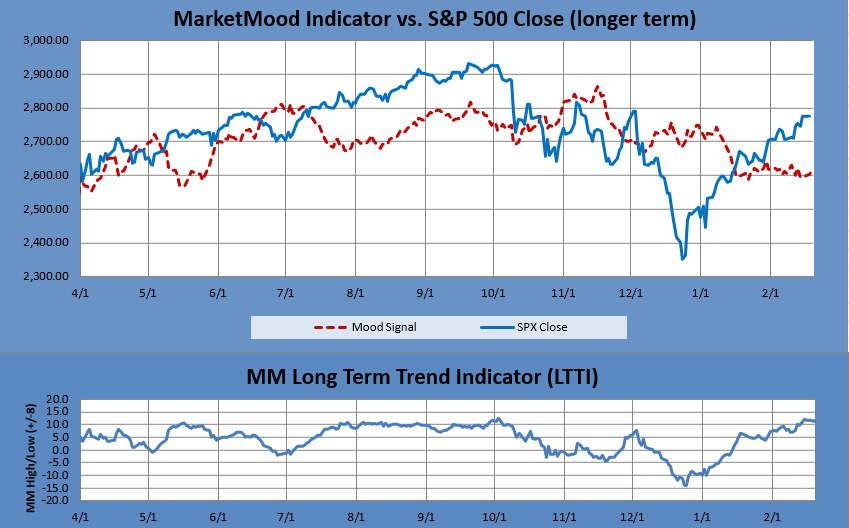
The MM LTTI measures trend strength using the divergence between the market trend and the forecast trend. A move above +8 or below -8 is bullish or bearish respectively. A value over 10 or under -10 followed by a move back through +/-8 signals a high or low is likely in. A subsequent move below +5 (or above-5) signals a trend change to bearish (or bullish).
