MarketMood Tuesday: Last Day of The Decade
 By
By
Where We've Been:
MMI for Monday open was down, and the market didn't quite make it, opening just a few cents above Friday's close. MMI was looking for some "dark clouds" and a down day today, and the market complied with a down close.
Today's trader mood context was: "change, crisis"
Today's trader mood challenge was: "financial matters, issues close to home"
Where We're Going
The mood pattern for Monday and Tuesday would normally point to something seriously destructive as well as the potential for negative governmental or geopolitical events, and MMI is down. It is possible, however that it's simply reflecting the end of the year and decade (with an "end of the world" type pattern). If there is news related to this, it could show up anytime through Wednesday. MMI for Wednesday (Thursday open) and Thursday are both in the same direction that Tuesday closes. MMI2 is giving hints of a surprise twist as it's pointing down for Tuesday, but up for Thursday open and Thursday.
Tomorrow's trader mood context: "action, movement, volatility"
Tomorrow's trader mood challenge: "isolation, quiet"
MMI Tuesday: close down
MarketMood Data Info:
Internet search theme MMI inputs: TV, finale, men, sports, school, radio, prank, death
Short Term Forecast:
Base case, Tuesday closes down: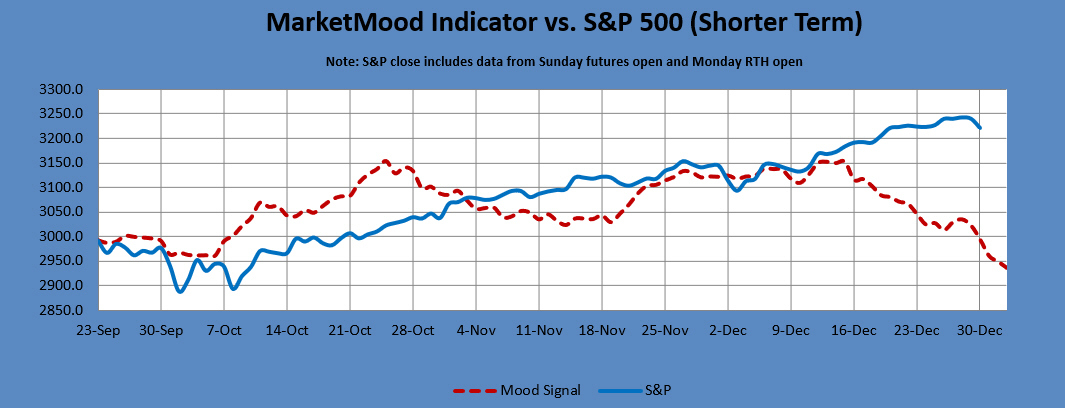
Alt case, Tuesday closes up:
Next 3 Days:
| Date | Daily MMI | MMI 2* |
|---|---|---|
| 12/31 | close down | down |
| 1/2 (open) | |
up |
| 1/2 | |
up |
*MMI 2 uses an alternate algorithm to convert the same sentiment source data to S&P direction.
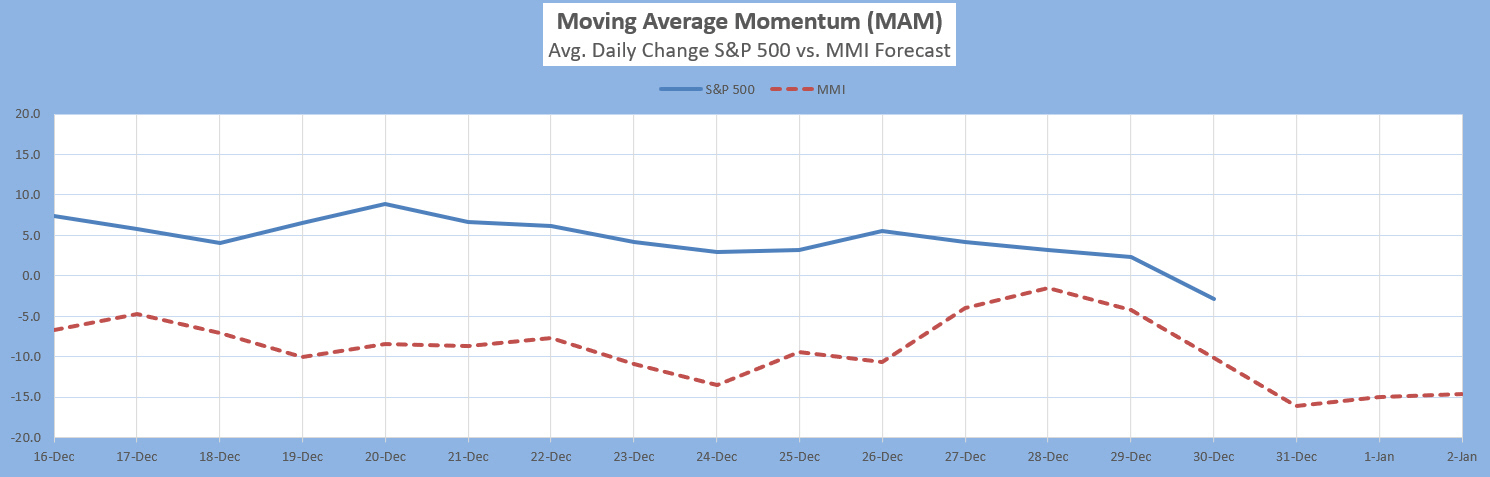
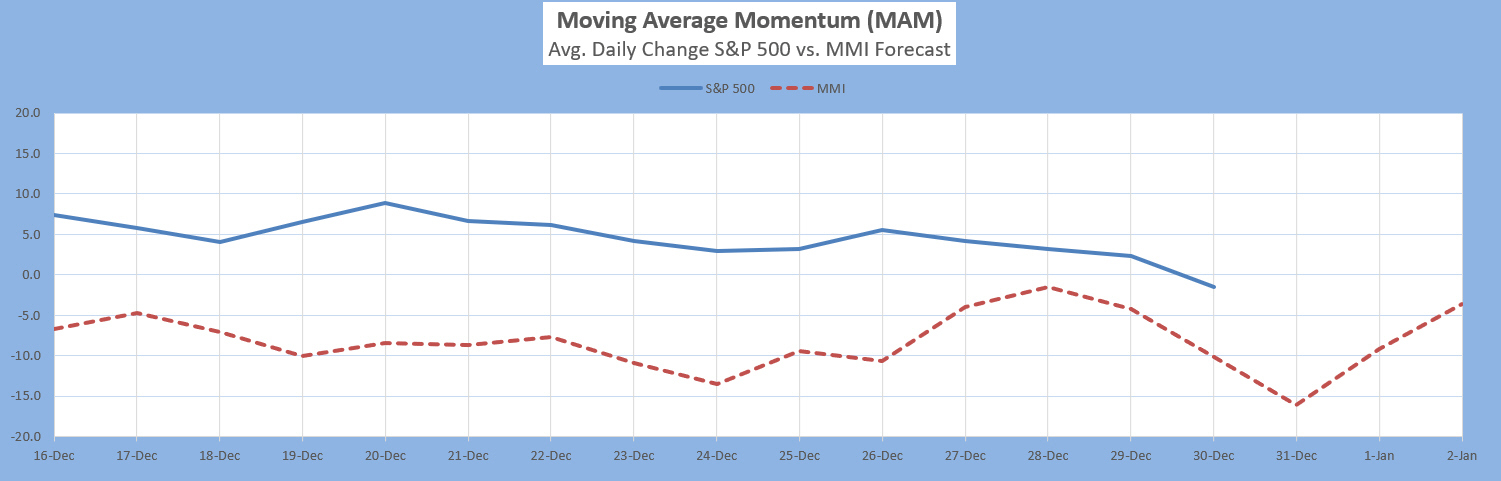
The Moving Average Momentum (MAM) Indicator's last major high signal was 11/1-9, 2018. The closing high on 11/7 fulfilled that. The last major low signal was 12/24-31, 2018. The market rallied strongly after the close on Dec. 24 which fulfilled the major low signal.
Latest signal: The recent MAM significant trend change signal has extended even more and is now continuing through January 7. With a strong enough drop this would signal a major low; with a large enough rally this would signal a local high. No confirmation of direction would simply reaffirm that an EW diagonal is in play.
Base case, Tuesday closes down:
Alt case, Tuesday closes up:
Intermediate Term Forecast:
In what is still primarily a bull market, even though very long in the tooth, there is a Sharp Drop Alert for December 27-January 6. Weekly info shows a currently topping market turning to a choppy downtrend over the next few weeks.
MM MACD signal is unconfirmed SELL and the intermediate trend is UP. There is no swing trade signal.
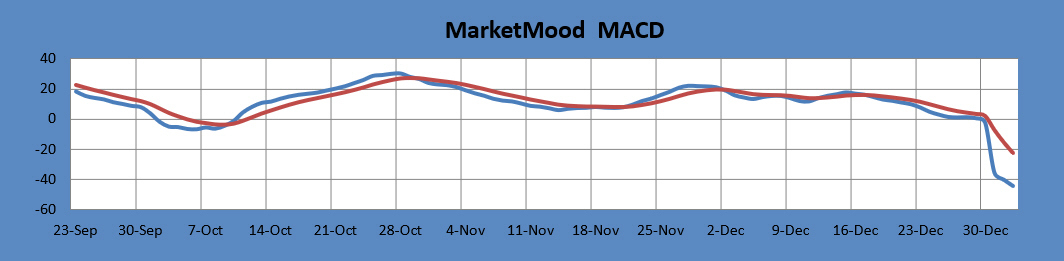
The MM MACD is similar to a standard MACD, except that it uses the MMI signal data to extend several days beyond today, while the standard MACD relies solely on historical market data.
Long Term Forecast:
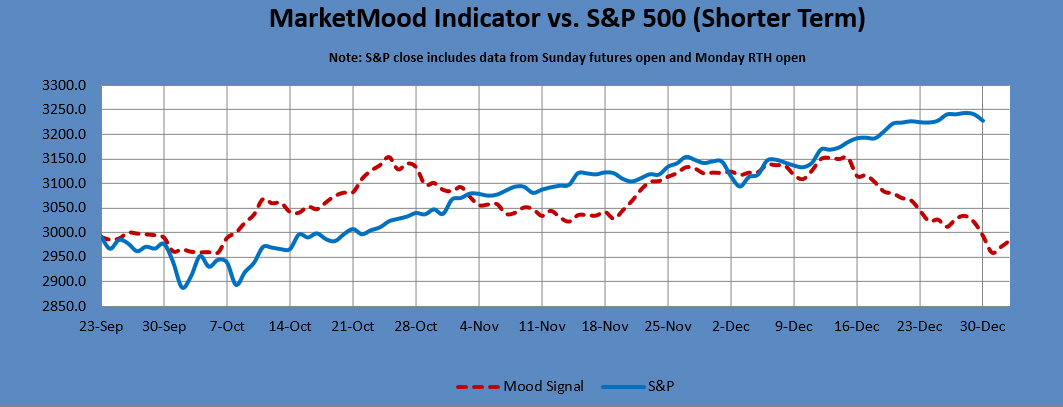
The long term trend indicator (LTTI) continues in bullish trend / topping mode. The long term trend is indicated by the general divergence between the stock market and the mood generated forecast (see long term chart below). The MM Long Term Trend Indicator (bottom chart) which is derived from this divergence, indicates: "Bullish Trend, Hold long long-term positions." The MM LTTI has had this indication since 13 Feb 2019.
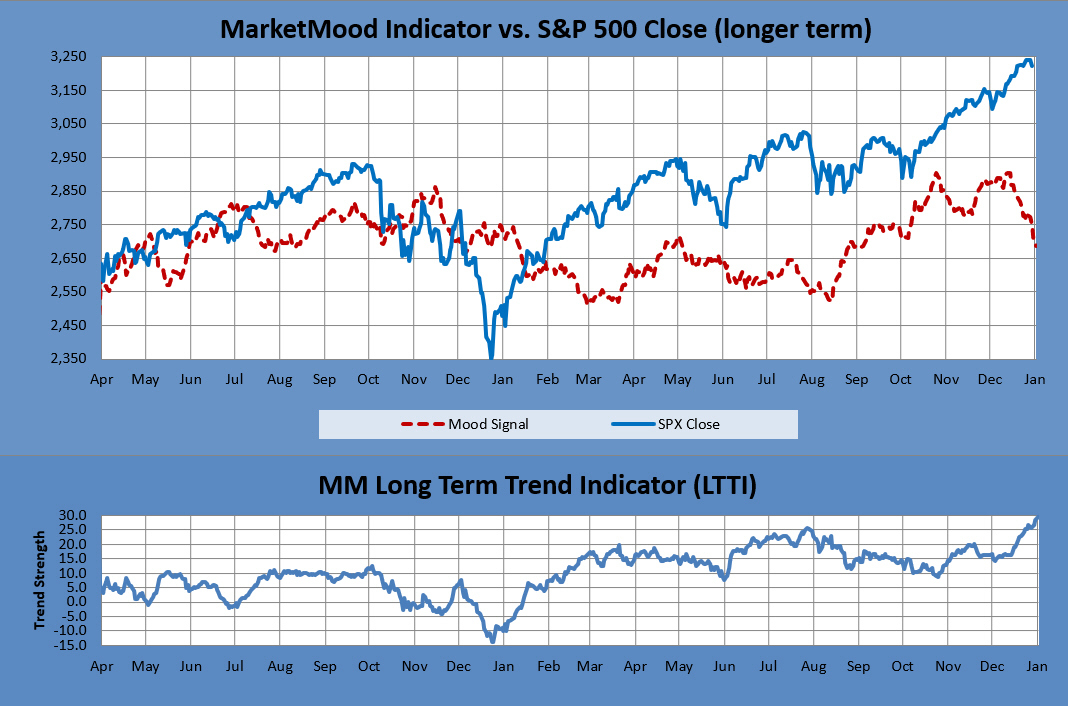
The MM LTTI measures trend strength using the divergence between the market trend and the forecast trend.
Recent Performance:
MMI's recent performance relative to a long term average of over 60% correct daily up or down calls indicates how closely it's been tracking with the market near term. In the basic daily performance stats below, posted signal flip days aren't counted in the total as there is no call on those days as to a positive or negative close. Monday open does count as a call unless it's part of a flip.
Note: MMI does least well in these conditions-- 1) EW 4th wave, 2) EW b wave, 3) Diagonals, and 4) Topping. More than one of these conditions concurrently present will further diminish performance.
This week so far: 1/2 calls correct (50%). Up calls NA. Down calls 1/2 (50%).
Last week: 2/4 calls correct (50%). Up calls 1/1 (100%), Down calls 1/3 (33%).
December so far: 7/18 calls correct (39%). Up calls 2/3 (67%), Down calls 5/15 (33%).
November: 13/20 calls correct (65%). Up calls 8/12 (67%), Down calls 5/8 (63%).
Note: Changes to next day MMI signals occur about 5% of the time, and will be announced in updates as well as the daily report should they occur. Same day signals will not change. Day 2 and 3 signals reflect the most current information, and are subject to change. The default trade per the daily signals is executed at market on close. except on Mondays, as there is a signal for Monday open (i.e. "weekend close") and Monday close. The daily MMI signals are correct as daily direction calls about 63% of the time. Please manage your trading risk accordingly.
