MarketMood Tuesday: Hoping for Better Days
 By
By
Where We've Been:
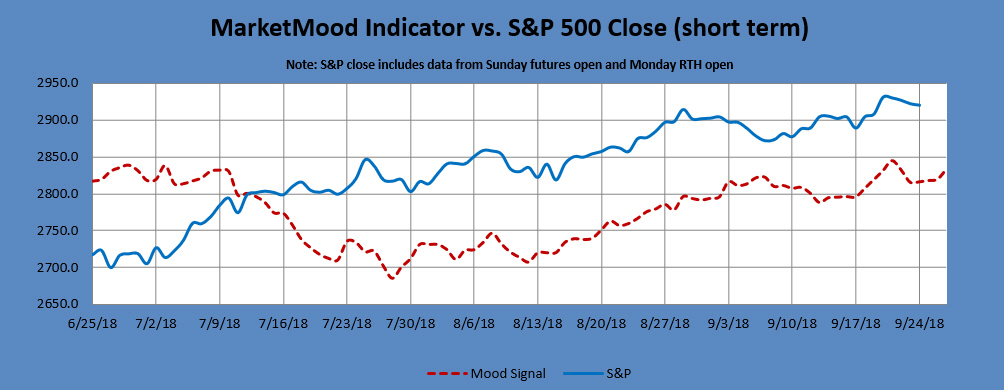
A multi-day mood pattern which began last Tuesday continued through the weekend trying to keep away an underlying gloomy mood. As was said on Friday, "Unfortunately, a signal flip should kick in prior to Monday open with a shift towards aggression and a focus on geopolitics (it looks like that already happened). "The market might not be happy with this" (Looks like it wasn't). Markets gapped down at open.
MMI for Monday open was: flip from up to down; S&P 500 opened -0.27%.
Monday-Wednesday is a multi-day pattern which implies a new (mildly) bullish chapter. Basically, a bullish EW subwave wants to start, but it might take a few days for it to kick in. Until then, markets might be stuck searching for a low. The S&P 500 closed nearly unchanged from open with more downside likely before bottoming.
MMI for Monday was: searching for a low; S&P 500 closed +0.07% from open.
Where We're Heading:
Monday-Wednesday is a multi-day pattern which implies a new (mildly) bullish chapter. Basically, a bullish EW subwave wants to start, but it might take a few days for it to kick in. Until then, markets might be stuck searching for a low.
MMI for Tuesday-Wednesday: searching for a low
Reminder of this week's outlook: This week the mood pattern concludes a two week period of denial in the face of bearish news or facts, delusion, and general irrationality. Facts are likely to be experienced as an intrusion and annoyance in the face of a preference for denial and oblivion. Unfortunately, this pattern is usually followed by an unpleasant "wake up call." This is likely to occur no later than the first week of October. Markets are likely to move primarily up or sideways until something pops the bubble, and jars it awake. There is a "sharp drop alert" in effect-- an elevated risk of an unusually sharp market drop (which may also suddenly reverse) through October 5.
MarketMood Data Info:
Internet search theme MMI inputs: nature, fall, calendar, men, sports, winner, school
Short Term Forecast:
Next 3 Days:
| Date | Daily MMI |
|---|---|
| 9/25 | Searching for a low |
| 9/26 | Turning up |
| 9/27 | Close same as 9/26 |
Note: Changes to next day MMI signals occur about 5% of the time, and will be announced in updates as well as the daily report should they occur. Same day signals will not change. Day 2 and 3 signals reflect the most current information, and are subject to change. The default trade per the daily signals is executed at market on close. except on Mondays, as there is a signal for Monday open (i.e. "weekend close") and Monday close. The daily MMI signals are correct as daily direction calls about 63% of the time. Please manage your trading risk accordingly.
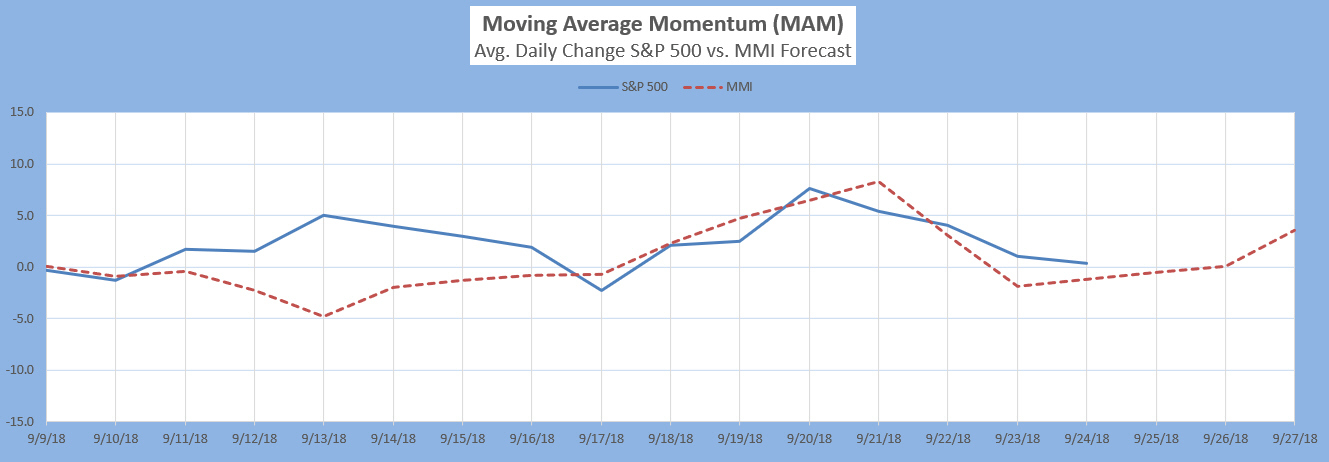
The Moving Average Momentum (MAM) Indicator last signaled a major trend change with a major LOW indication between April 18-25 (there was a closing low on the 25th which repeated slightly lower on May 3-- a major low).
The last few MAM signals (significant trend change, no direction specified) have only confirmed that the current move in the S&P is most likely an Elliott Wave diagonal.
Intermediate Term Forecast:
The primary outlook is that a corrective move is in progress. Weekly charts are nearly flat over the next couple of weeks, then turning down. They are also showing an elevated risk of a sharp drop through Oct. 5 (i.e. "sharp drop alert"). Monthly charts show (roughly) October as a low.
MM MACD signal is NEUTRAL and the intermediate trend is UP. There is no swing trade signal.
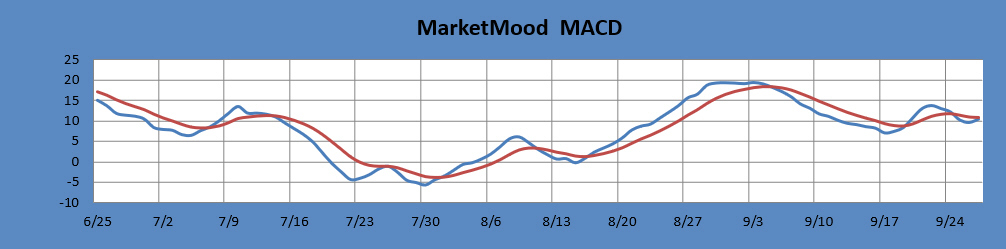
The MM MACD is similar to a standard MACD, except that it uses the MMI signal data to extend several days beyond today, while the standard MACD relies solely on historical market data.
Long Term Forecast:
The long term forecast remains strongly bullish. The bullish long term trend is indicated by the generally positive divergence between the stock market and the mood generated forecast (see long term chart below). The MM Long Term Trend Indicator (bottom chart) which is derived from this divergence, indicates: Bullish Trend, hold long positions. The MM LTTI has had this same bullish indication since 12 Sept., 2016.
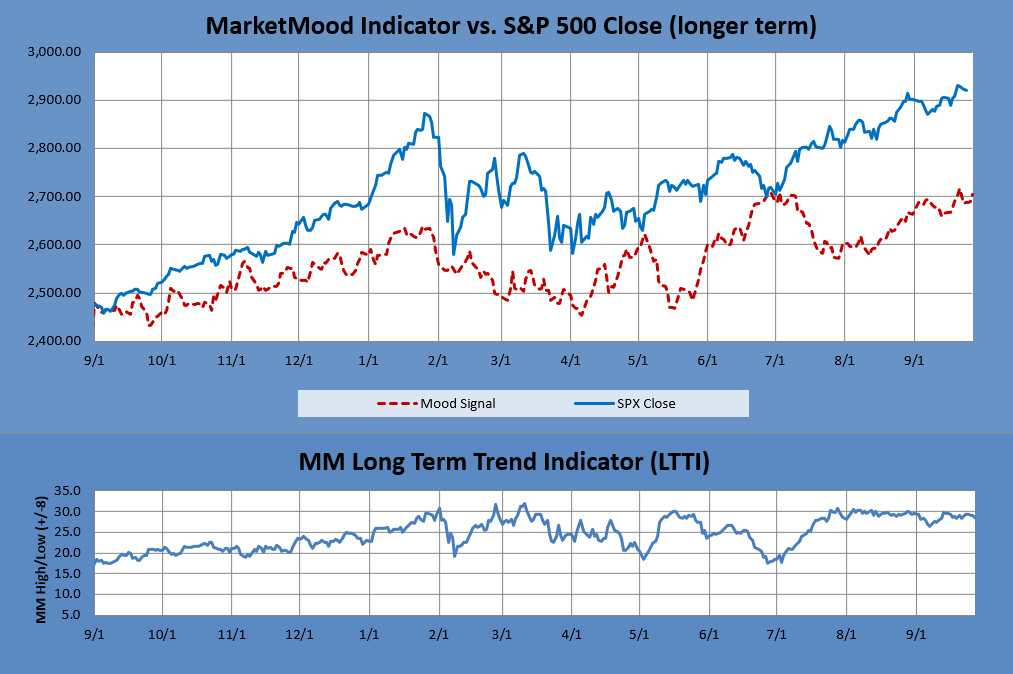
The MM LTTI measures trend strength using the divergence between the market trend and the forecast trend. A move above +8 or below -8 is bullish or bearish respectively. A value over 10 or under -10 followed by a move back through +/-8 signals a high or low is likely in. A subsequent move below +5 (or above-5) signals a trend change to bearish (or bullish).
