MarketMood Tuesday: Emotions - Market Analysis for Nov 23rd, 2020
 By
By
Where We've Been:
MMI was looking down for today (below open). The market really tried to go down, but at the end of the day closed above the open.
Where We're Heading:
The mood pattern for Tuesday reflects both strong emotions and letting go-- an odd mix. However, with Michigan just now certifying the election results, it's not difficult to see how such a mix could play out. MMI is leaning up for Tuesday, but it's too close for a call, and it's pointing down for Wednesday and Thursday. MMI2 is looking for a local top near Tuesday.
MM Trend Trader continues on swing buy in both the main and higher probability signals. A close Tuesday below 3572 SPX would signal a temporary pullback is back in play.
Internet search theme source data for MMI inputs (mood vs. effect inverted): man, chaos, info, president, ally, hair, sports, business, contract, store, shooting. injuries, hospital, police, legal, death, accusation
Next 3 Days:
| Date | Daily MMI | MMI 2* |
|---|---|---|
| 11/24 | ? | up |
| 11/25 | down | down |
| 11/27 | down | up |
*MMI 2 uses an alternate dynamic algorithm to convert the same sentiment source data to S&P direction as the original MMI algorithm.
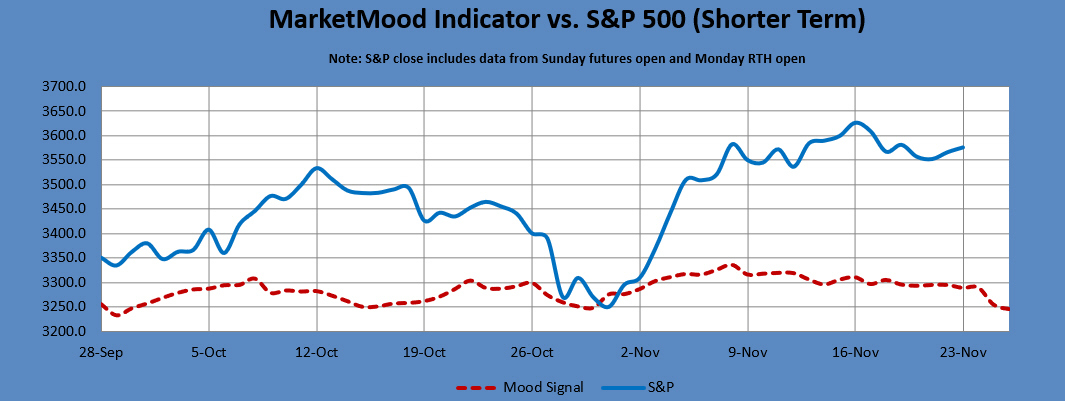
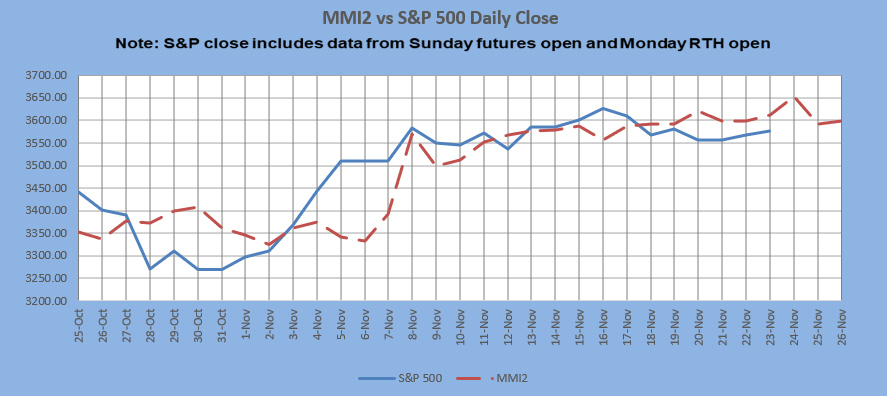
Latest MarketMood Indicator vs. S&P 500 Charts:
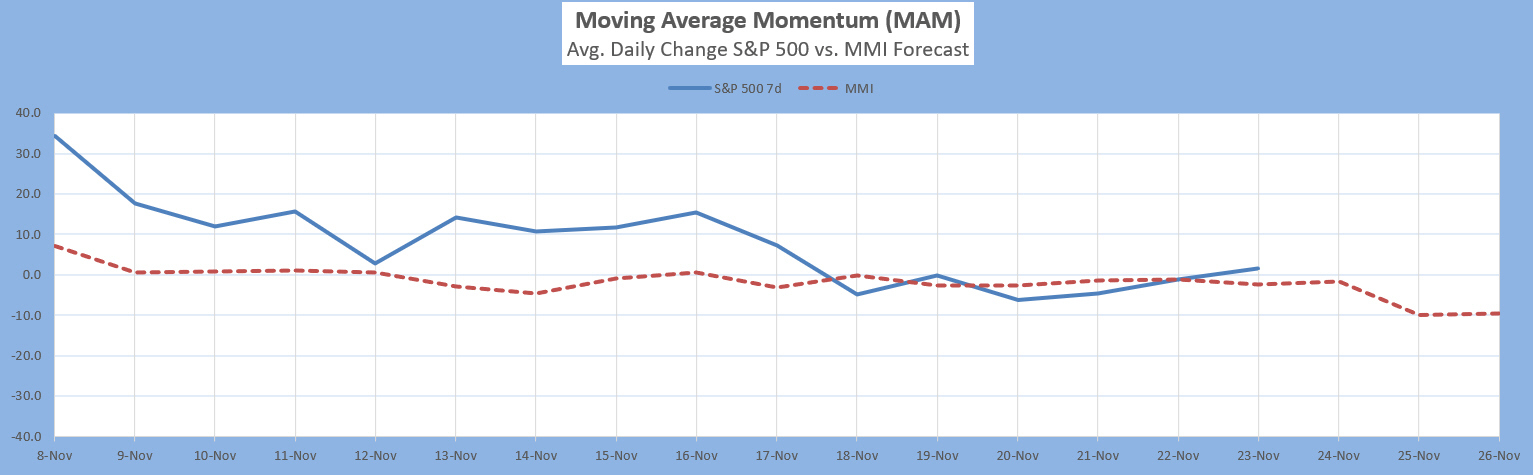
The Moving Average Momentum (MAM) Indicator's previous major low signal was 24-31 Dec., 2018. The market rallied strongly following the close on Dec. 24 which fulfilled the major low signal. There was an ambiguous low signal from 20-27 Mar. 2020. It was a combo major low and minor high in the same region. The market did make a substantial low in that time-frame. The last major high signal was 8-27 Jan. 2020 (possibly the longest window ever). The closing high on 17 Jan. appeared to have fulfilled that, as the market dropped over 100 points following this window. Although there was a Yet, the market quickly recovered its losses and made a new high. However, with that being the first major trend change signal in over a year, we needed to take seriously that it was pointing to something very different happening in both mood and market. Soon after the market saw its largest losses ever.
Current status: neutral
Intermediate Term Forecast:
The big picture showed that if October was "serious" there would be an "optimistic new chapter" for November. This doesn't mean there won't be pullbacks during the month, but an overall bullish outlook must be assumed unless proven otherwise. On a weekly scale, the mood pattern points to aggression and potential geopolitical escalation over the coming week or two. It is not clear how the market will respond to that.
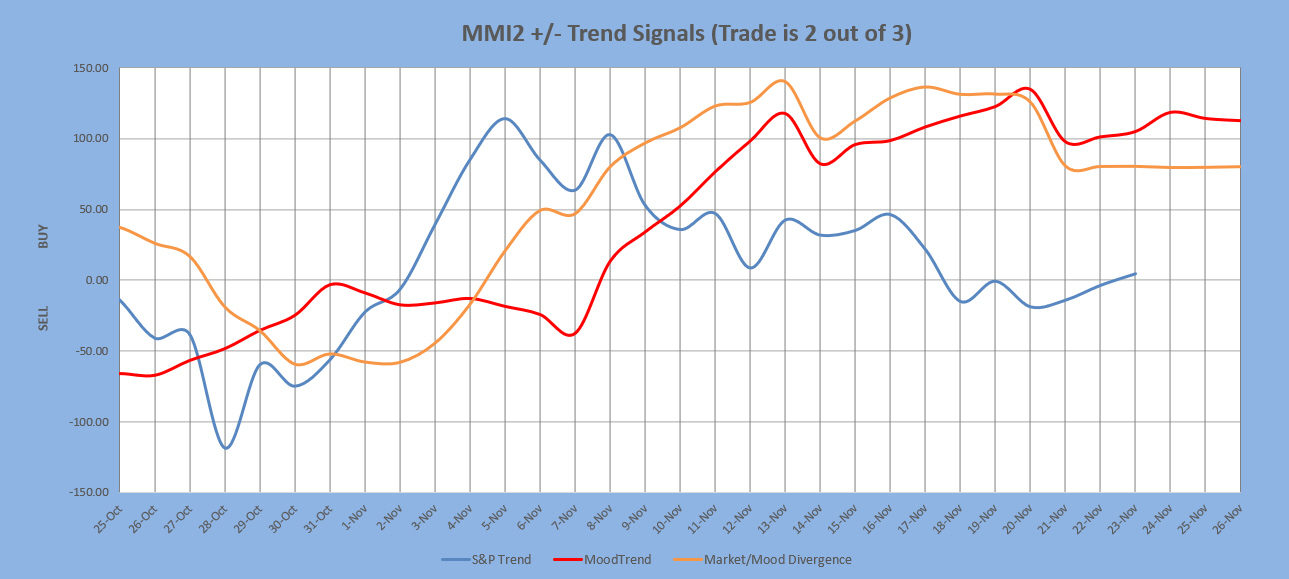
MarketMood Trend Trader
The chart below uses three sentiment trend lines to generate a swing trade signal of BUY if 2 out of 3 are greater than 0 and SELL if 2 out of 3 are less than 0. Trade length averages 9 days, but can be as short as 1 and has been as long as 60. The signal is updated each day after market close. Back-testing shows this signal averaging about 12 SPX points per trade over the last few years. Back-testing a higher probability signal derived only from the two mood related trend lines averages 33 SPX points per trade, but only initiates trades about once every 3 weeks. Note: past performance does not guarantee future results.
Current signal: BUY since 5 Nov. HP signal: Buy since 9 Nov. AM
MM MACD signal is unconfirmed SELL and the intermediate trend is UP. There is no swing trade signal.
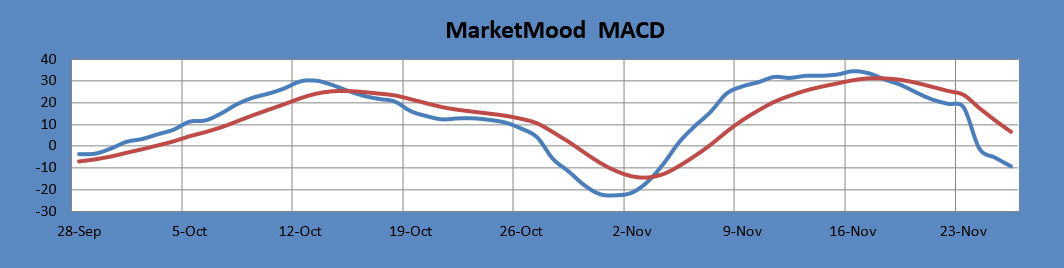
The MM MACD is similar to a standard MACD, except that it uses the MMI signal data to extend several days beyond today, while the standard MACD relies solely on historical market data.
Long Term Forecast:
The long term trend is indicated by the general divergence between the stock market and the mood generated forecast (see long term chart below). The MM Long Term Trend Indicator (bottom chart) which is derived from this divergence, indicates: "Bullish Trend, hold long long-term positions." The MM LTTI has had this indication since 4 Nov 2020.
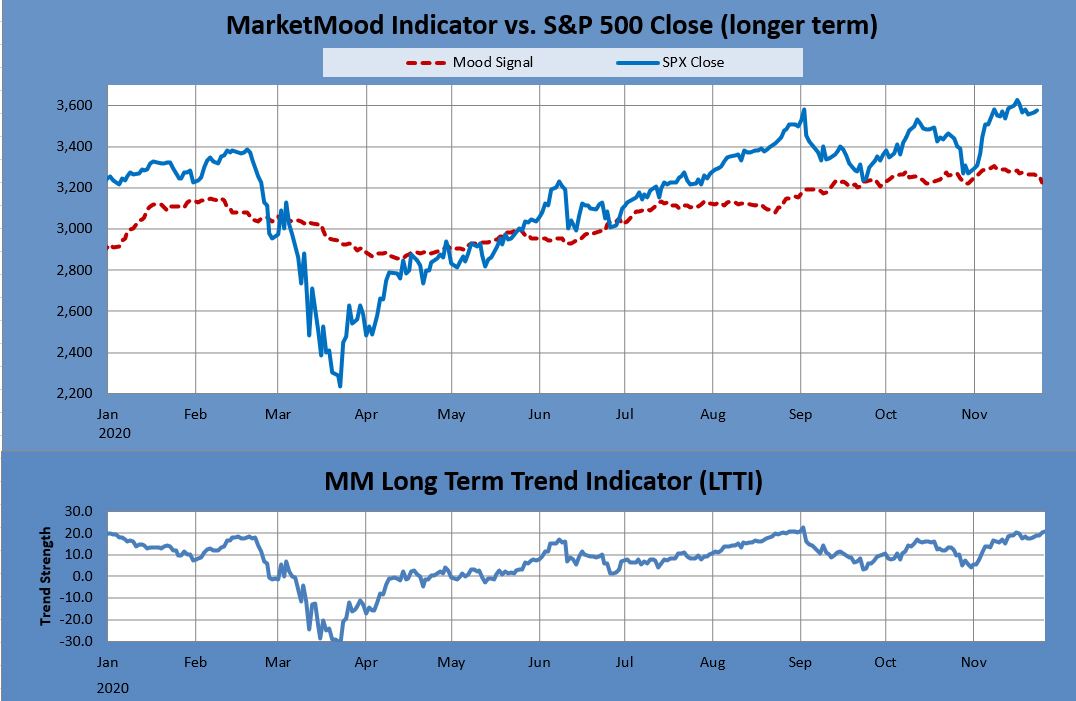
The MM LTTI measures trend strength using the divergence between the market trend and the forecast trend.
For the Extremely Curious:
In normal mode, the top of the mood chart is primary, and in inverted mode the bottom of the chart is. Inverted mode is currently in effect.
Tomorrow's market mood and news themes: letting go, moving on
Tomorrow's trader context is: patience, risk avoidance
Limitations:
MMI does least well in these conditions-- 1) EW 4th wave, 2) EW b wave, 3) Diagonals, and 4) Topping. More than one of these conditions concurrently present will further diminish performance.
Note: Changes to next day MMI signals occur about 5% of the time, and will be announced in updates as well as the daily report should they occur. Same day signals will not change. Day 2 and 3 signals reflect the most current information, and are subject to change. The default trade per the daily signals is executed at market on close. except on Mondays, as there is a signal for Monday open (i.e. "weekend close") and Monday close. Historical data implies that the daily MMI signals tend to be correct as daily direction calls about 63% of the time over the long term.
