MarketMood Tuesday: Breaking News
 By
By
Where We've Been:
MMI for the weekend was up and the market opened up. Today we were watching for a possible flip from down to up, which the market appears to have provided today (down near open, ambiguous, then turning up). We will still have to remain extra vigilant with a possible diagonal in play which can create false positive flips. It is encouraging that it played out today in the market in what appeared to be standard flip form.
Where We're Heading:
The mood pattern for the week ahead tends to accompany a hunker down or generally risk averse sentiment. The mood pattern for tomorrow implies negatively perceived news, a "wake-up call" or something requiring attention. MMI is down for Tuesday-Thursday. However, if the market closes nearly unchanged Tuesday (< +/- 4.97 from today's close in SPX cash), The flip from today is rescinded and MMI for Wednesday and Thursday will be up.
CDMS is likely to be Sell for Wednesday and Thursday if MMI for Wednesday and Thursday remains down. It's likely to be No Trade otherwise.
The MAM major high signal implies a substantial pullback is imminent with the highest probability for it to begin between Dec. 21-31 2021. It would be highly unusual for this pullback to begin more than one week outside of this range (i.e. beyond Jan. 7), but of course anything is possible.
MM Trend Trader remains fully bullish which means it sees any pullbacks (which may or may not be substantial) as temporary and likely to be quickly reversed. This reflects the current picture that whatever high we are waiting for has not yet been confirmed as being in.
Internet search theme source data for MMI inputs (mood vs effect inverted): beginning, calendar, celebration, woman, music, TV, men, sports, school, loser, anniversary, death, nostalgia, winner, completion, fire, homes, destruction, wind, grief, tradition
Next 3 Days (days 2 and 3 are considered preliminary):
Date | Daily MMI | CDMS* |
1/4 | Down | No Trade |
1/5 | Down | Sell |
1/6 | Down | Sell |
*Composite Daily Mood Signal (CDMS) combines the MMI daily signal and the various MM trend and trading indicators into one overall daily trade signal. Possible signals are buy, strong buy, no trade, sell, and strong sell. A "strong" signal implies a higher probability of success rather than necessarily a larger point move. FYI-- hypothetical daily close to close trade stats so far: 4/6 strong buys (67%), 8/12 buys (67%), 2/3 strong sells (67%), 6/15 sells (40%), 57 no trade days. Jan.: 1 no trade day.
Latest charts follow the summary table.
MM Indicators and Trading Parameters Summary:
Indicator | Scope | Direction |
LTTI | Longer Term Trend | Early Bearish |
MMTT (main) | Medium Term Trend | Bullish |
MMTT (HP) | Medium Term Trend | Bullish |
MMTT (b/b) | Near Term bull/bear Trend Line | 4774 SPX (cash) |
MM MACD | Swing Trade | Sell < 4789 |
Note: Medium term is roughly 1 week to 2 months. Longer term is roughly 1 month to a year or more.
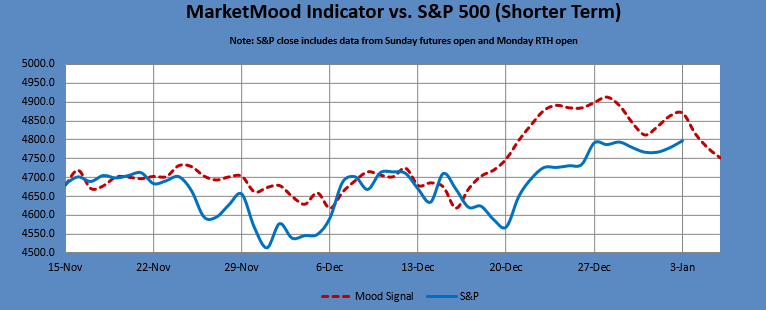
MMI vs. S&P 500 daily
MMI2 vs S&P 500 daily
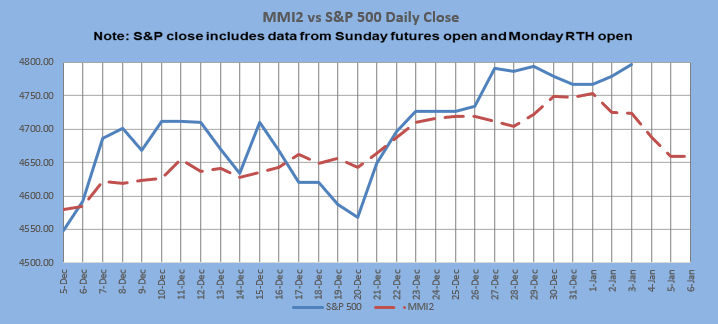
** MMI 2 uses an alternate dynamic algorithm to convert the same sentiment source data to S&P direction that the original MMI algorithm uses.
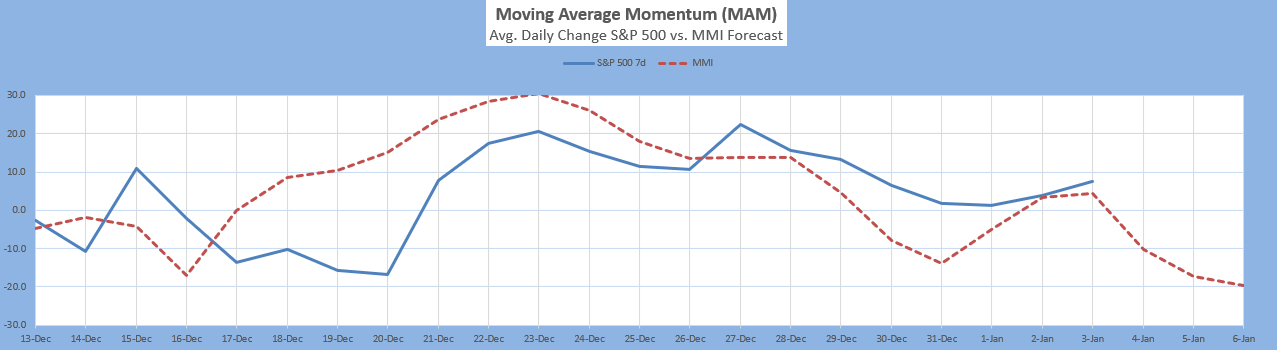
The Moving Average Momentum (MAM): The last prior MAM major low signal was Sept. 9-16. The market made a low on Sept 20, followed by a bounce and new low on Oct. 4. The last major high signal was Oct. 25 - Nov. 14 with the last actual closing high one week outside of the range at Nov. 21.
Current status: neutral
Latest signal: Major High likely between Dec. 21 and Dec. 31. It would be highly unusual for this pullback to begin more than one week outside of this range (i.e. beyond Jan. 7).
Intermediate Term Forecast:
The intermediate trend has turned back up and the longer term trend is early bearish. The MAM major high signal implies a substantial pullback is imminent with the highest probability between Dec. 21-31 2021. It would be highly unusual for this pullback to begin more than one week outside of this range (i.e. beyond Jan. 7), but of course anything is possible. A more comprehensive bigger picture outlook is currently unavailable as it's not clear at the moment how to reconcile a monthly chart pointing primarily up through March and a Quarterly chart pointing down for the first half of the year. Another month of data (through end of January) may help to determine if one of these are inverted or if there is a path where they may reconcile as is. If there are no corrections to be made, it would point to a market with a high whipsaw potential through at least the first quarter of 2022.
MarketMood Trend Trader
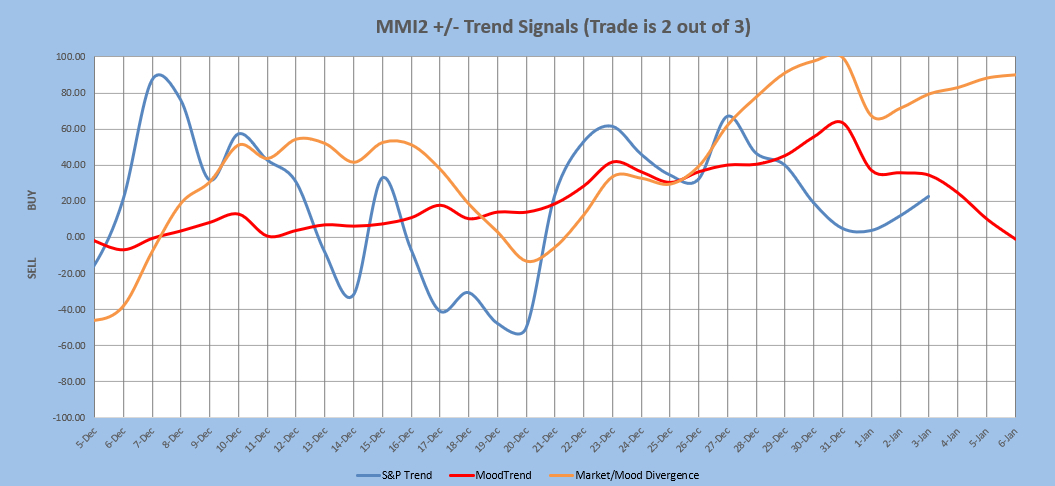
The chart below uses three sentiment trend lines to generate a swing trade signal of BUY if 2 out of 3 are greater than 0 and SELL if 2 out of 3 are less than 0. Trade length averages 9 days, but can be as short as 1 and has been as long as 60. The signal is updated each day after market close. Back-testing shows this signal averaging about 12 SPX points per trade over the last few years. Back-testing a higher probability signal derived only from the two mood related trend lines averages 33 SPX points per trade, but only initiates trades about once every 3 weeks. Note: past performance does not guarantee future results.
Current signal: Buy since 22 Dec. HP signal: Buy since 22 Dec.
MM MACD signal is Sell and the trend (per MMI vs S&P 500) is Down < 4789 SPX cash. The swing trade signal is sell < 4789.
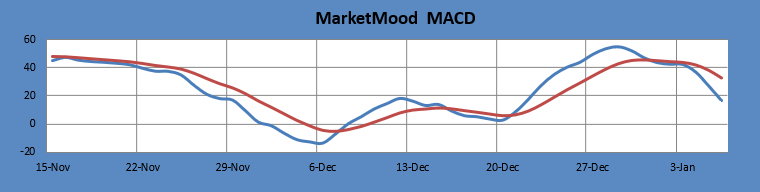
The MM MACD is similar to a standard MACD, except that it uses the MMI signal data to extend several days beyond today, while the standard MACD relies solely on historical market data.
Long Term Forecast:
The long term trend is indicated by the general divergence between the stock market and the mood generated forecast (see long term chart below). The MM Long Term Trend Indicator (bottom chart) which is derived from this divergence, indicates: "Early Bearish Trend, enter/hold short long-term positions." The MM LTTI has had this indication since 18 Dec. 2021 (first posted 22 Dec.).
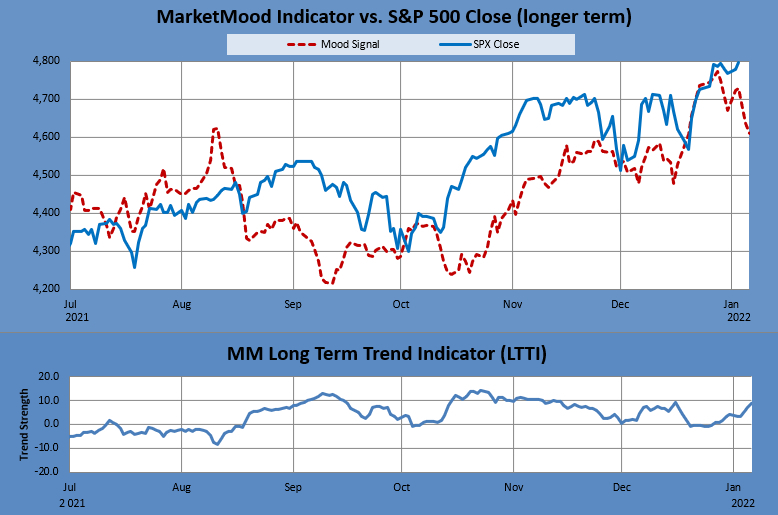
The MM LTTI measures trend strength using the divergence between the market trend and the forecast trend.
For the Extremely Curious:
In normal mode, the top of the mood chart is primary, and in inverted mode the bottom of the chart is. Inverted mode is currently assumed to be in effect.
Tomorrow's market mood and news: wake-up call, attention required
Tomorrow's trader context: patience, self-restraint
Limitations:
MMI does least well in these conditions-- 1) EW 4th wave, 2) EW b wave, 3) Diagonals, and 4) Topping. More than one of these conditions concurrently present will further diminish performance.
Note: Changes to next day MMI signals occur about 5% of the time, and will be announced in updates as well as the daily report should they occur. Same day signals will not change. Day 2 and 3 signals reflect the most current information, and are subject to change. The default trade per the daily signals is executed at market on close. except on Mondays, as there is a signal for Monday open (i.e. "weekend close") and Monday close.
