MarketMood Tuesday: A Peak of Sorts
 By
By
Where We've Been:
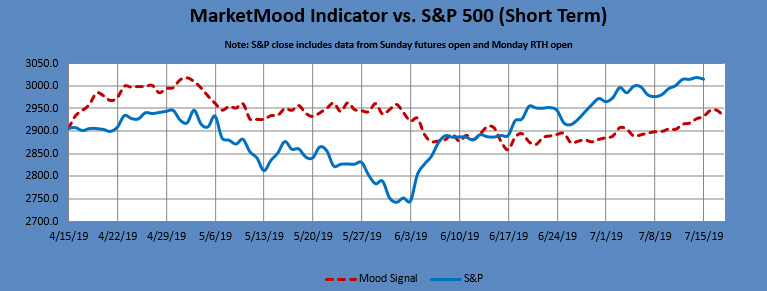
MMI for Monday was upish, and the market was expected to at least try to close above open. At the last second, the S&P 500 closed barely up for the day, but it did not make it above open.
Today's trader mood context was: "self-restraint, tolerance."
Today's trader mood challenge was: "decision time, outsiders."
Where We're Going
MMI is showing a local top on Tuesday. MMI 2 (an alternate algorithm from the same source data) is pointing down Tuesday and Wednesday. I will still be primarily following the MMI, but am looking at how to use both of these together.
MMI Tuesday: up / topping
Tomorrow's trader mood context: "financial matters, issues close to home"
Tomorrow's trader mood challenge: "decision time, outsiders."
Sharp Drop Alert: The weekly chart is showing the overbought + flatline signature that implies heightened risks for a sharp drop through July 22. This is not a sell signal, and does not imply a trend change or immediate selloff. It says to be on watch for a possible sharp drop during this period.
MarketMood Data Info:
Internet search theme MMI inputs (mood vs effect inverted): man, surgeon, creative, history, honor, international, trade, contract, sports, death, grief, aliens, rally
Short Term Forecast:
Next 3 Days:
(Note: MMI 2 uses an alternate algorithm to convert sentiment to S&P direction)
| Date | Daily MMI | MMI 2 |
|---|---|---|
| 7/16 | up / local high | down |
| 7/17 | close down | down |
| 7/18 | close up | up |
Note: Changes to next day MMI signals occur about 5% of the time, and will be announced in updates as well as the daily report should they occur. Same day signals will not change. Day 2 and 3 signals reflect the most current information, and are subject to change. The default trade per the daily signals is executed at market on close. except on Mondays, as there is a signal for Monday open (i.e. "weekend close") and Monday close. The daily MMI signals are correct as daily direction calls about 63% of the time. Please manage your trading risk accordingly.
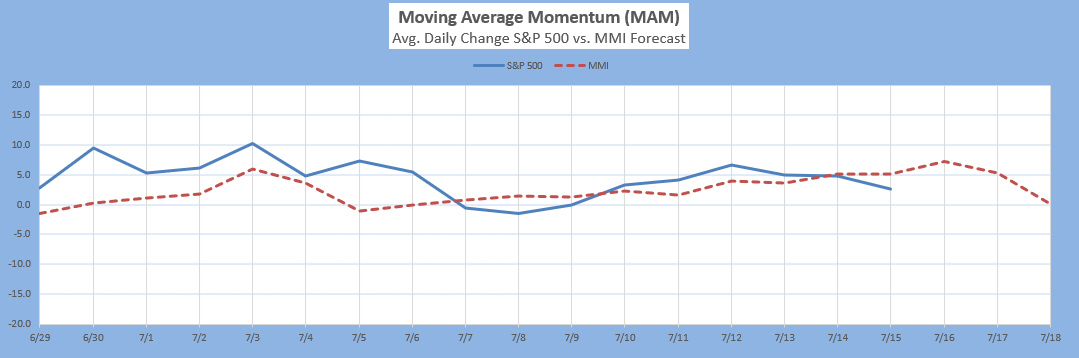
The Moving Average Momentum (MAM) Indicator's last major high signal was 11/1-9. The closing high on 11/7 fulfilled that. The last major low signal was 12/24-31. The market rallied strongly after the close on Dec. 24 which fulfilled the major low signal.
Intermediate Term Forecast:
The weekly forecast implies a bearish slant through for the next couple of weeks, with a strong rally likely for the last week of the month. Monthly charts show a multi-month low by sometime this month. Early data shows a big trend change (down) around October.
MM MACD signal is unconfirmed NEUTRAL and the intermediate trend is UP. There is no swing trade signal.
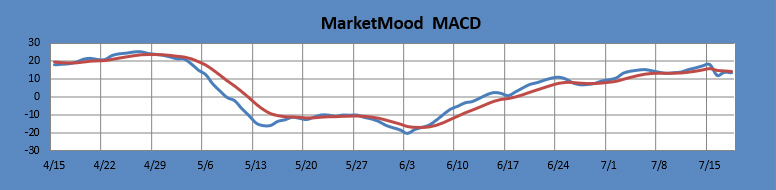
The MM MACD is similar to a standard MACD, except that it uses the MMI signal data to extend several days beyond today, while the standard MACD relies solely on historical market data.
Long Term Forecast:
The long term trend indicator (LTTI) continues in bullish trend / topping mode. The long term trend is indicated by the general divergence between the stock market and the mood generated forecast (see long term chart below). The MM Long Term Trend Indicator (bottom chart) which is derived from this divergence, indicates: "Bullish Trend, Hold long long-term positions." The MM LTTI has had this indication since 13 Feb 2019.
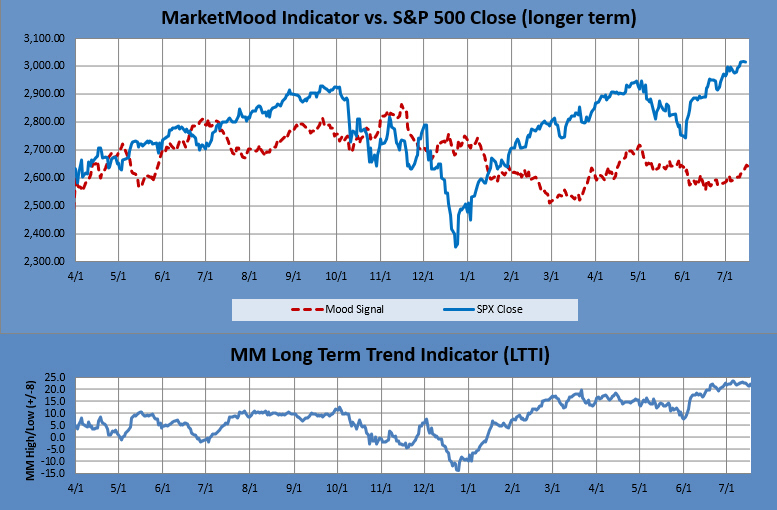
The MM LTTI measures trend strength using the divergence between the market trend and the forecast trend. A move above +8 or below -8 is bullish or bearish respectively. A value over 10 or under -10 followed by a move back through +/-8 signals a high or low is likely in. A subsequent move below +5 (or above-5) signals a trend change to bearish (or bullish).
