MarketMood Thursday: Shaking Things Up
 By
By
Where We've Been:
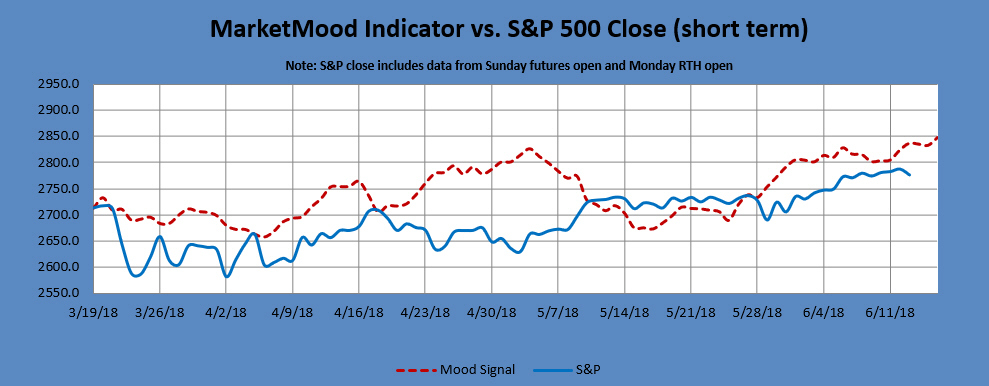
Wednesday's mood pattern was a volatile "breakout or breakdown" pattern with MMI giving the odds to the upside. The market tried unsuccessfully to break out on the upside, and then turned down breaking below the range of the last few days. While it wasn't a historically large market drop, the market did close with the largest net change in a week.
MMI for Wednesday was: breakout or breakdown (up most likely); S&P 500 closed -0.40%
Where We're Heading:
Both Thursday and Friday's mood pattern reflects government related instability or global crises. MMI for Thursday is a flip from up to down (bounce likely prior to further downside), and MMI for Friday is close down.
MMI for Thursday: flip from up to down
MarketMood Data Info:
Internet search theme MMI inputs (mood vs effect inverting): video games, business, animal, race, gambling, winner, man, star, body, dead
Short Term Forecast:
Next 3 Days:
| Date | Daily MMI |
|---|---|
| 6/14 | flip from up to down |
| 6/15 | close down |
| 6/18 (open) |
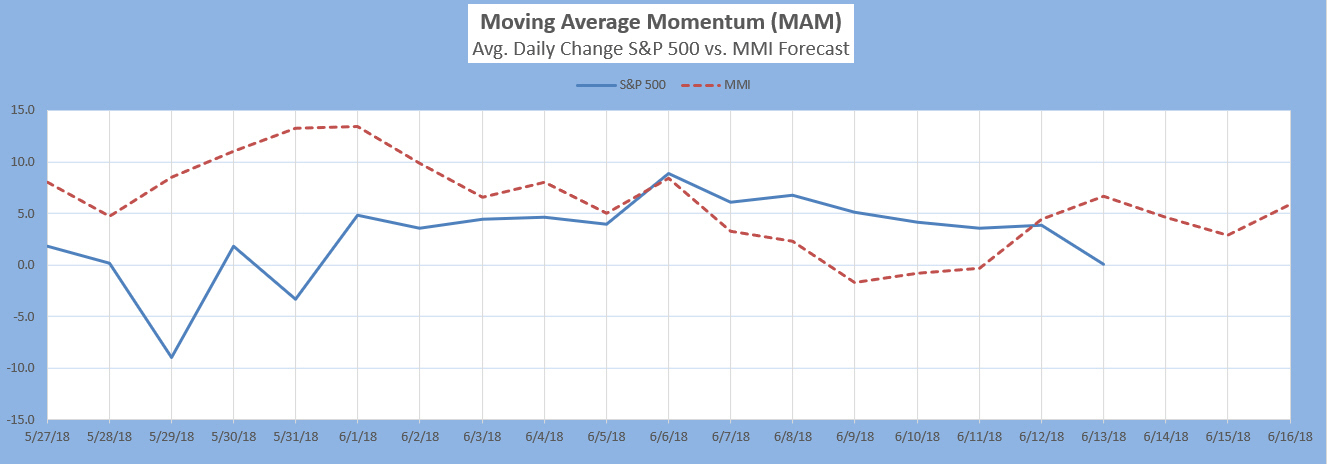
The Moving Average Momentum (MAM) Indicator last signaled a major trend change with a major LOW indication between April 18-25. There have been no definitive signals since.
Note: Changes to next day MMI signals occur about 5% of the time, and will be announced in updates as well as the daily report should they occur. Same day signals will not change. Day 2 and 3 signals reflect the most current information, and are subject to change. The default trade per the daily signals is executed at market on close. except on Mondays, as there is a signal for Monday open (i.e. "weekend close") and Monday close. The daily MMI signals are correct as daily direction calls about 63% of the time. Please manage your trading risk accordingly.
Intermediate Term Forecast:
The primary outlook is that a countertrend corrective move is in progress. Monthly charts show a trendchange in July.
MM MACD signal is NEUTRAL, and the intermediate trend is DOWN. The trade signal is N/A.
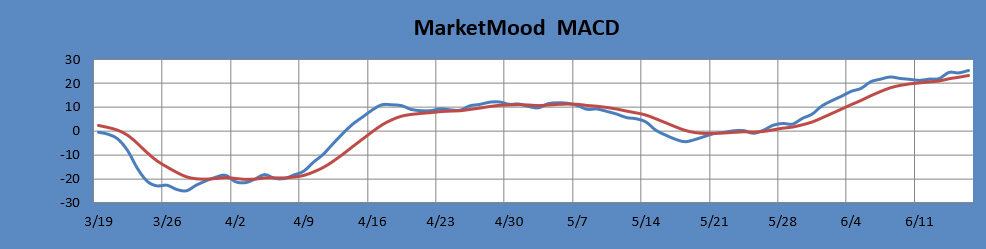
The MM MACD is similar to a standard MACD, except that it uses the MMI signal data to extend several days beyond today, while the standard MACD relies solely on historical market data.
Long Term Forecast:
The long term forecast remains strongly bullish. The bullish long term trend is indicated by the generally positive divergence between the stock market and the mood generated forecast (see long term chart below). The MM Long Term Trend Indicator (bottom chart) which is derived from this divergence, indicates: Bullish Trend, hold long positions. The MM LTTI has had this same bullish indication since 12 Sept., 2016.
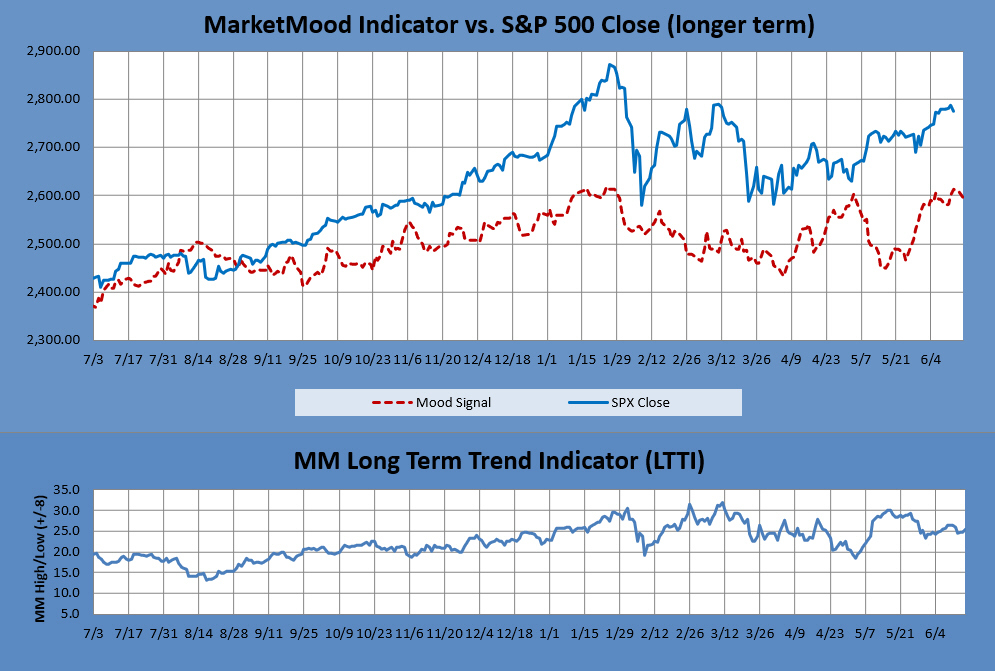
The MM LTTI measures trend strength using the divergence between the market trend and the forecast trend. A move above +8 or below -8 is bullish or bearish respectively. A value over 10 or under -10 followed by a move back through +/-8 signals a high or low is likely in. A subsequent move below +5 (or above-5) signals a trend change to bearish (or bullish).
