MarketMood Thursday: Problems at Home
 By
By
Where We've Been:
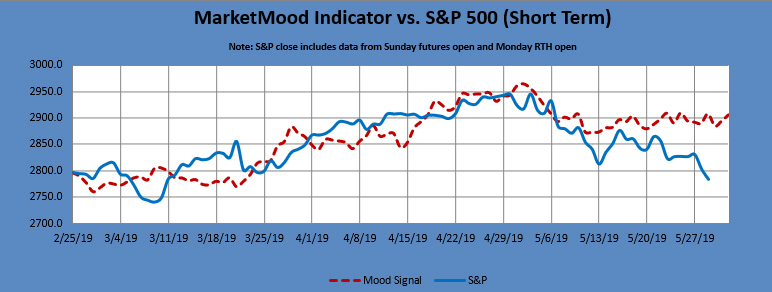
Today's mood pattern implied "opposite day" and the market gave us that, but not exactly in the way expected. Yesterday the market opened up and turned down. Today, the market started down, and turned up. MMI was looking for an up close, but the upside at the end of the day was not enough to get there. It was a feeble bounce attempt, at best.
Today's mood context was: "Clarity, plans, 'yes we can'"
Today's mood challenge was: "Wrong assumptions, denial, fog"
Where We're Going
The mood pattern for Thursday-Friday implies a focus on economic or domestic issues. MMI is down for Thursday and up for Friday. Saturday (i.e. sometime over the weekend) is showing as a completion of whatever occurs Thursday-Friday.
Tomorrow's mood context: "home, family, economy'"
Tomorrow's mood challenge: "decisions, evaluation"
MMI for Thursday: close down
MarketMood Data Info:
Internet search theme MMI inputs (mood versus effect inverted): calendar, honor, death, military, remembrance, holiday, race, sport
Short Term Forecast:
Next 3 Days:
| Date | Daily MMI |
|---|---|
| 5/30 | close down |
| 5/31 | close up |
| 6/3 (open) |
Note: Changes to next day MMI signals occur about 5% of the time, and will be announced in updates as well as the daily report should they occur. Same day signals will not change. Day 2 and 3 signals reflect the most current information, and are subject to change. The default trade per the daily signals is executed at market on close. except on Mondays, as there is a signal for Monday open (i.e. "weekend close") and Monday close. The daily MMI signals are correct as daily direction calls about 63% of the time. Please manage your trading risk accordingly.
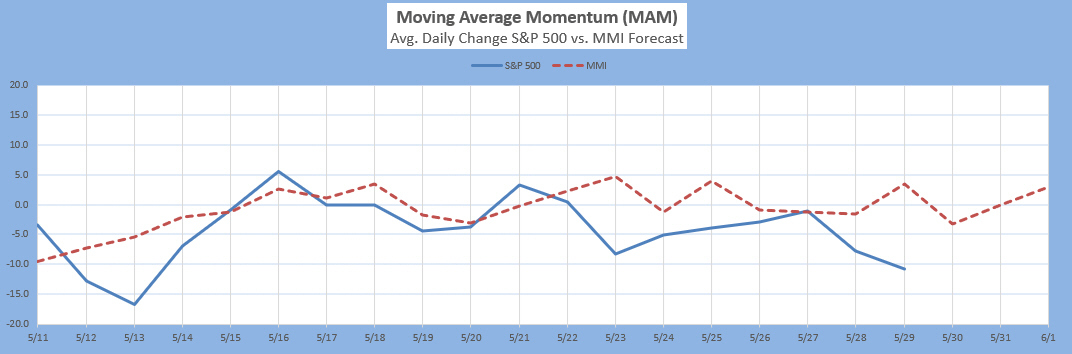
The Moving Average Momentum (MAM) Indicator's last major high signal was 11/1-9. The closing high on 11/7 fulfilled that. The last major low signal was 12/24-31. The market rallied strongly after the close on Dec. 24 which fulfilled the major low signal.
Intermediate Term Forecast:
The primary outlook is that a corrective downward move is in progress. Weekly charts show a bounce the last week of May, followed by continued downside. The weekly MM MACD issued an "exit long positions" signal the week of April 22. Monthly charts show a next low in June or July. A sharp rally is likely later in the year.
MM MACD signal is NEUTRAL and the intermediate trend is DOWN. There is no swing trade signal.
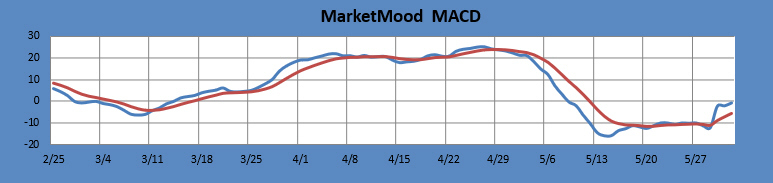
The MM MACD is similar to a standard MACD, except that it uses the MMI signal data to extend several days beyond today, while the standard MACD relies solely on historical market data.
Long Term Forecast:
The long term trend indicator (LTTI) continues in bullish trend / topping mode, and is in the area (< 10, > 8) that shows at least a local top is in place. The long term trend is indicated by the general divergence between the stock market and the mood generated forecast (see long term chart below). The MM Long Term Trend Indicator (bottom chart) which is derived from this divergence, indicates: "Bullish Trend, Hold long long-term positions." The MM LTTI has had this indication since 13 Feb 2019.
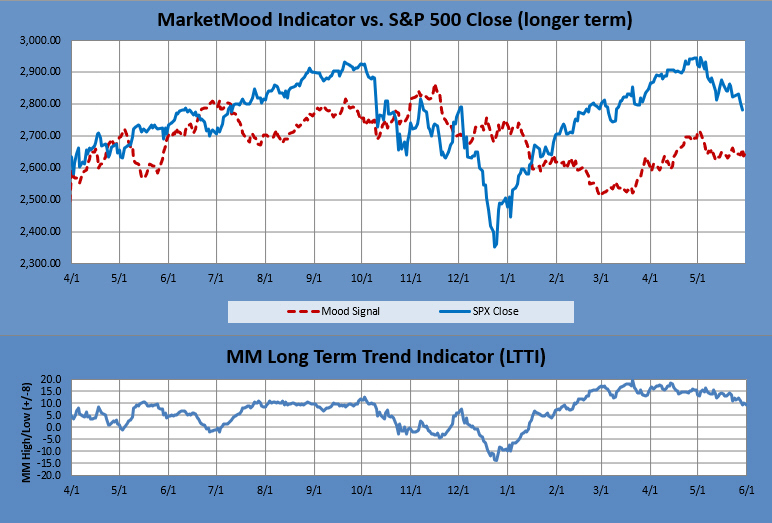
The MM LTTI measures trend strength using the divergence between the market trend and the forecast trend. A move above +8 or below -8 is bullish or bearish respectively. A value over 10 or under -10 followed by a move back through +/-8 signals a high or low is likely in. A subsequent move below +5 (or above-5) signals a trend change to bearish (or bullish).
