MarketMood Thursday: Non-linear
 By
By
Where We've Been:
MMI was up, on a day focused on the Fed. This was the only day this week with the mood pattern having any reference to a government focus and thus the only day that in any way intersects with our weekly "government intervention" pattern. While not an exact match, with the big rally following the Fed chair's comments, this might be it as far as what we were watching for this week.
Indicator changes: MM Trend Trader's main signal turned bullish. CDMS went to Daily Sell for tomorrow solely due to the MAM uber-overbought reading.
Where We're Heading:
MMI for Thursday and Friday is down. The pattern often points to strong emotions, irrational decisions, and may accompany displays of "panic."
Preliminary MMI for the weekend is same direction as Friday actually closes. There's a good chance CDMS will be a Daily Sell for Friday IF the market closes above 4298 (SPX cash) which would continue the MAM uber-overbought reading. Otherwise, we'll just have to see what tomorrow brings.
MM Trend Trader is showing an ambivalent trend and is bullish or bearish depending on which side of the bull / bear trendline the market is on. It's currently bullish. A close tomorrow under 4209 SPX would turn it bearish.
Internet search theme source data for MMI inputs: man, inventor, technology, discrimination, history, honored, woman, music, grief, family, relationship, mental illness, suicide, award, sports, losers
Next 3 Days (days 2 and 3 are considered preliminary):
Date | Daily MMI | CDMS* |
5/5 | Down | Daily Sell |
5/6 | Down | possible Daily Sell |
5/9 (open) |
*Composite Daily Mood Signal (CDMS) combines the MMI daily signal and the various MM trend and trading indicators into one overall daily trade signal. Possible signals are intraday buy, daily buy, no trade, intraday sell, and daily sell. An "intraday" signal is more likely to be a mixed day, so the implied strategy is to watch for day trade setups in the indicated direction during the trading day. A "daily" signal points to less cross-currents and an implied strategy of entering at market close for the next day's trade.
TRADING STRATEGIES: Per LTTI, long term traders would be net short. Daily traders would be short, per CDMS Daily Sell.
Latest charts follow the summary table.
MM Indicators and Trading Parameters Summary:
Indicator | Scope | Direction |
LTTI | Longer Term Trend | Strong Bearish |
MMTT (main) | Medium Term Trend | Bullish > 4209 |
MMTT (HP) | Medium Term Trend | Neutral |
MMTT (b/b) | Near Term bull/bear Trend Line | 4209 SPX (cash) |
MM MACD | Swing Trade | Neutral |
Note: Medium term (MMTT) is roughly 1 week to 2 months. Longer term (LTTI) is roughly 1 month to a year or more.
MMI vs. S&P 500 daily
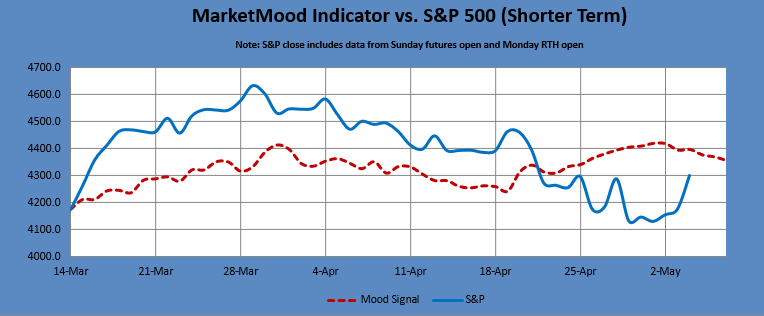
MMI2 vs S&P 500 daily
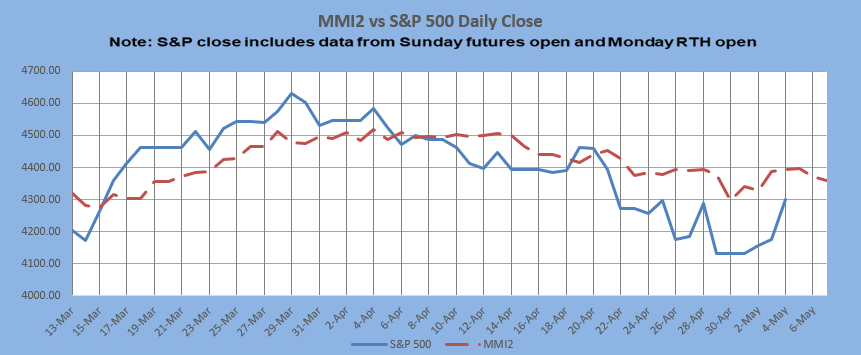
** MMI 2 uses an alternate dynamic algorithm to convert the same sentiment source data to S&P direction that the original MMI algorithm uses.
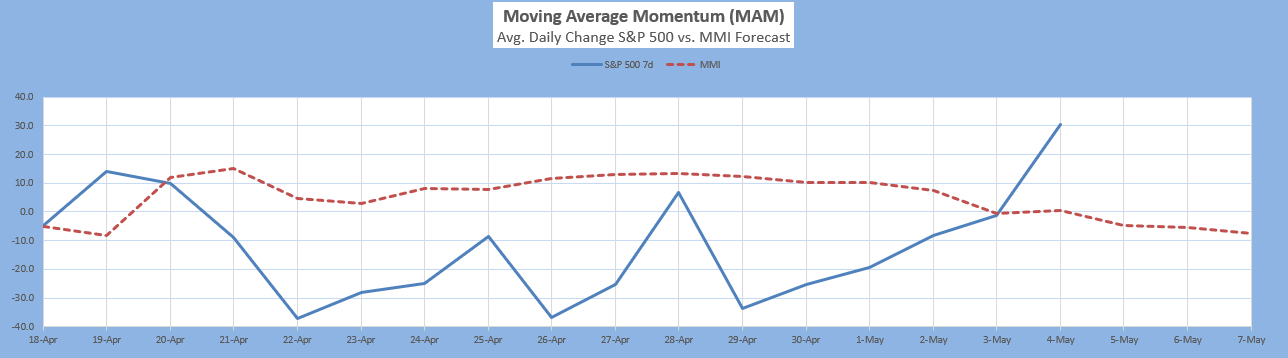
The Moving Average Momentum (MAM): The last clear MAM major low signal was Sept. 9-16, 2021. The market made a low on Sept 20, followed by a bounce and new low on Oct. 4. There was a combo major low / local high signal for Feb. 22-Mar. 21. The market made a closing low on Feb. 23, followed by a slightly lower double bottom with closing lows on Mar. 8 and Mar. 13. This double bottom, still within the timeframe, was followed by a substantial rally. The last major high signal was for Jan. 28 - Feb. 4 with the high on Feb. 2. This directly followed a previous major high signal for Dec. 21 - Dec. 31 with the actual high on Jan. 4, 2022. Both of these were followed by substantial declines.
Current status: extremely overbought
Intermediate Term Forecast:
The monthly charts show a general downtrend with the potential for large moves in either direction through June. Our quarterly chart is showing a sharp downtrend through sometime in the second quarter. Please see the latest video presentation with a special update for April 29-May 7 which implies a "government intervention" at some point in this period. We must proceed with caution as it's not clear if there are additional meanings to "government intervention" in times of war.
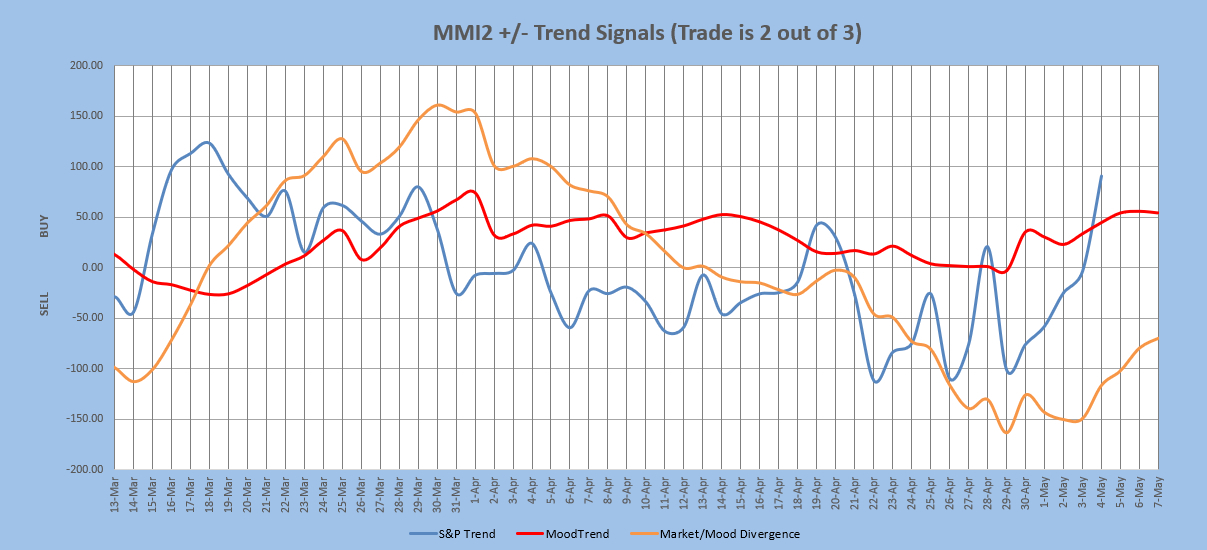
MarketMood Trend Trader
The chart below uses three sentiment trend lines to generate a swing trade signal of BUY if 2 out of 3 are greater than 0 and SELL if 2 out of 3 are less than 0. Trade length averages 9 days, but can be as short as 1 and has been as long as 60. The signal is updated each day after market close. Note: because this is a trend trader it is not recommended for trading during periods of little to no trend.
Current signal: Buy since May 4. HP signal: Neutral since Apr. 29.
MM MACD signal is Buy and the trend (per MMI vs S&P 500) is Down. There is no swing trade signal.
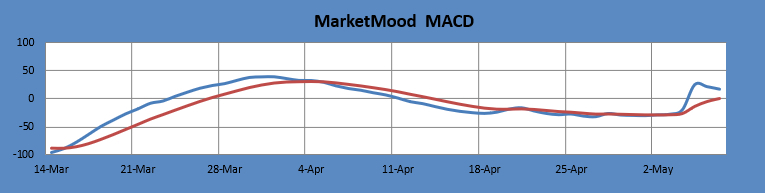
The MM MACD is similar to a standard MACD, except that it uses the MMI signal data to extend several days beyond today, while the standard MACD relies solely on historical market data.
Long Term Forecast:
The long term trend is indicated by the general divergence between the stock market and the mood generated forecast (see long term chart below). The MM Long Term Trend Indicator (bottom chart) which is derived from this divergence, indicates: "Strong Bearish Trend, hold bearish long-term positions." The MM LTTI has had this indication since 26 Apr. 2022. It was previously "bearish" from 22 Apr. 2022.
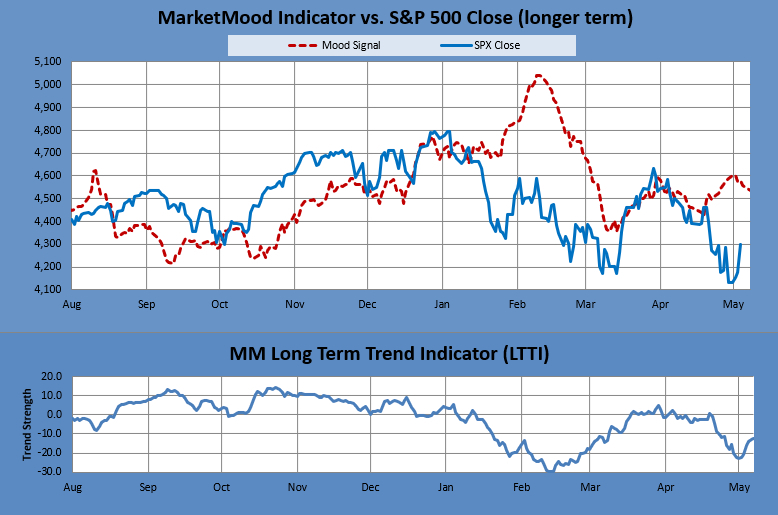
The MM LTTI measures trend strength using the divergence between the market trend and the forecast trend.
For the Extremely Curious:
In normal mode, the top of the mood chart is primary, and in inverted mode the bottom of the chart is. Normal mode is currently assumed to be in effect.
Tomorrow's market mood and news: shifting situations, emotions
Tomorrow's trader context: shifting situations, emotions
Limitations:
MMI does least well in these conditions-- 1) EW 4th wave, 2) EW b wave, 3) Diagonals, and 4) Topping. More than one of these conditions concurrently present will further diminish performance.
Note: Changes to next day MMI signals occur about 5% of the time, and will be announced in updates as well as the daily report should they occur. Same day signals will not change. Day 2 and 3 signals reflect the most current information, and are subject to change. The default timeframe covered by the daily signals is market close to market close. except on Mondays, as there is a signal for Monday open (i.e. "weekend close") and Monday close
