MarketMood Thursday: About Ready to Give Up
 By
By
Where We've Been:
Today's mood pattern was complex and included a positive government related component. The FOMC minutes and possibly the trade war news could be associated with that. There was also an international or presidential negative component which could be continued shutdown uncertainty. In other words, there was a lot of simultaneous ups and downs in sentiment.
MMI for Wednesday was: close down; S&P 500 closed +0.41%
Where We're Heading:
Thursday's mood pattern (and Friday's) retains some of Wednesday's "bullish exhaustion" component. This implies that bulls will continue to buy until nothing is left, making it difficult for bears to make any sustained moves until bulls actually run out of steam. The primary mood component points to either international or presidential perceived negativity. The preliminary outlook for the weekend (Monday open) is down, especially if Friday closes down.
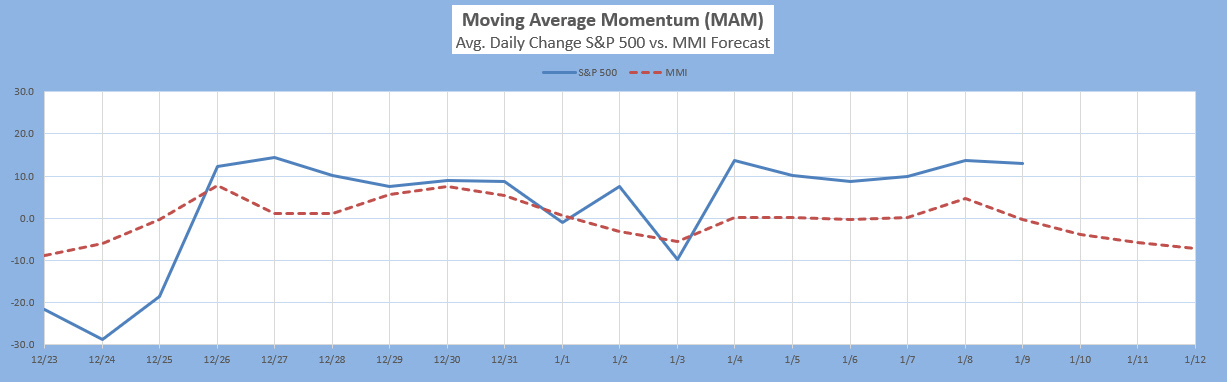
The MM MACD has issued a new swing trading signal, sell at or below 2581 SPX. The MAM continues to register an overbought condition which increases the likelihood for an immediate pullback.
MMI for Thursday: close down
MarketMood Data Info:
Internet search theme MMI inputs: TV, stars, awards, info, men, sports, winners, losers
Short Term Forecast:
Next 3 Days:
| Date | Daily MMI |
|---|---|
| 1/10 | close down |
| 1/11 | close down |
| 1/14 (open) | down (preliminary) |
Note: Changes to next day MMI signals occur about 5% of the time, and will be announced in updates as well as the daily report should they occur. Same day signals will not change. Day 2 and 3 signals reflect the most current information, and are subject to change. The default trade per the daily signals is executed at market on close. except on Mondays, as there is a signal for Monday open (i.e. "weekend close") and Monday close. The daily MMI signals are correct as daily direction calls about 63% of the time. Please manage your trading risk accordingly.
The Moving Average Momentum (MAM) Indicator's last major high signal was 11/1-9. The closing high on 11/7 fulfilled that. The last major low signal was 12/24-31. The market has rallied strongly since the closing low on Dec. 24 which has thus far fulfilled the major low signal.
Intermediate Term Forecast:
The primary outlook is that a corrective move is in progress. Weekly charts imply a bounce completing shortly and downtrend resuming. Monthly charts shows the market to be primarily in a corrective move through February then turning up sharply. A low is anticipated February/March.
MM MACD signal is confirmed SELL and the intermediate trend is DOWN. The swing trade signal is SELL at or below 2581 SPX.
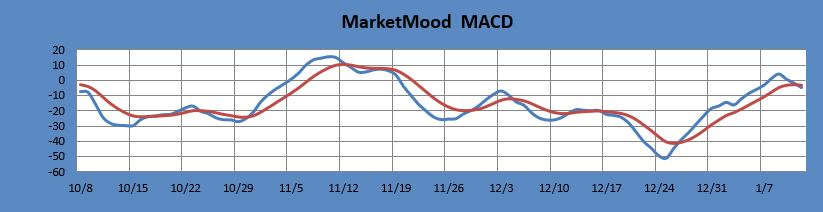
The MM MACD is similar to a standard MACD, except that it uses the MMI signal data to extend several days beyond today, while the standard MACD relies solely on historical market data.
Long Term Forecast:
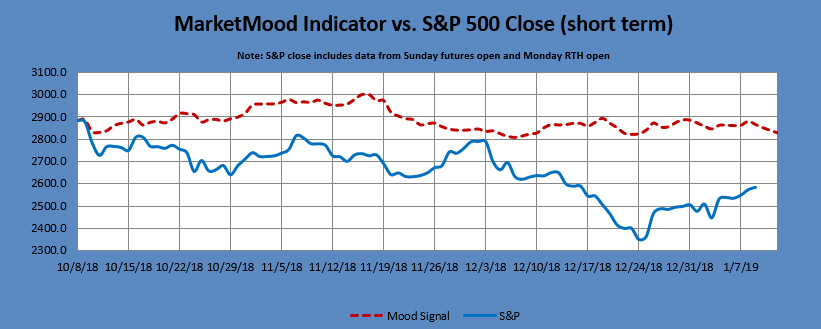
The long term forecast continues in bullish territory. Since a two year bullish trend has recently concluded, the trend may now vacillate between bearish, neutral and bullish for a bit before firmly deciding on its long term trend. The long term trend is indicated by the general divergence between the stock market and the mood generated forecast (see long term chart below). The MM Long Term Trend Indicator (bottom chart) which is derived from this divergence, indicates: Bullish Trend, enter bullish long term positions. The MM LTTI has had this indication since 27 Dec., 2018.
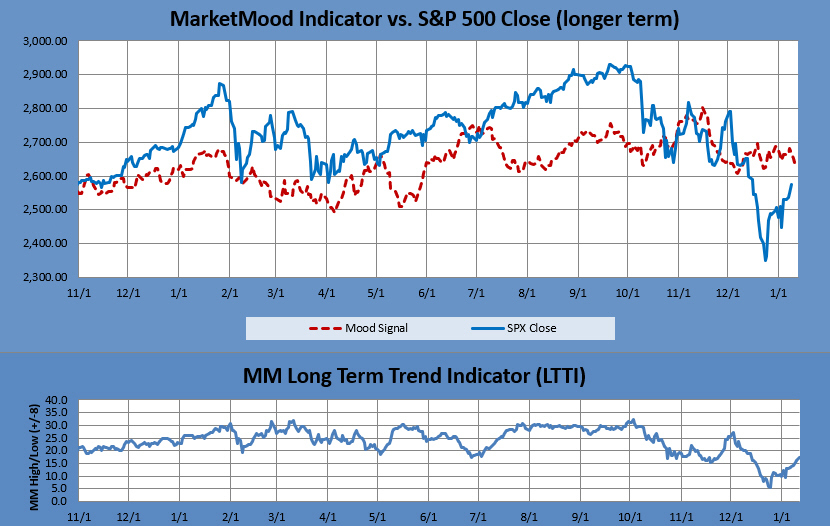
The MM LTTI measures trend strength using the divergence between the market trend and the forecast trend. A move above +8 or below -8 is bullish or bearish respectively. A value over 10 or under -10 followed by a move back through +/-8 signals a high or low is likely in. A subsequent move below +5 (or above-5) signals a trend change to bearish (or bullish).
