MarketMood Monday: Still Squeemish
 By
By
Where We've Been:
There is a "things are falling apart" kind of mood pattern for the weekend. People are likely to be in a "hunker down" kind of mood. MMI is showing a down open for Monday.
MMI for Monday open: down
Where We're Heading:
The mood pattern for Monday is still pointing to a risk averse outlook. There is not much at all that is pointing to outright celebrations and good cheer at the moment. There is even a component that implies an elevated disaster risk. Yet, MMI is nevertheless looking for a close up above open.
MMI for Monday: close up (above open)
Special Note for Wednesday: Charts are implying an incredibly big move for Wednesday in the stock market and gold. When outlier moves are shown like this, be prepared first for a large move in either direction. Secondly, watch for a large move in the direction indicated, and finally, remember that there is the possibility that nothing much will happen at all.
MarketMood Data Info:
Internet search theme MMI inputs (mood vs effect inverted): men, sports, winners, vote, uncertainty, supreme court, police, court, judgement, protest, murder
Short Term Forecast:
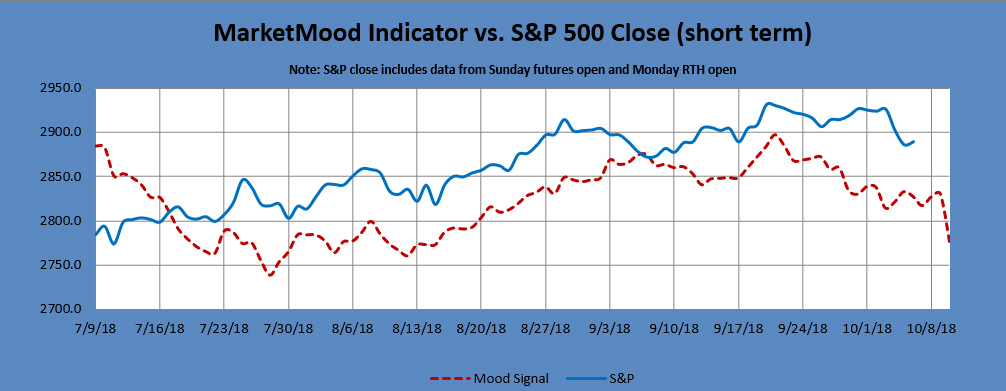
Next 3 Days:
| Date | Daily MMI |
|---|---|
| 10/8 (open) | Down |
| 10/8 | Close Up (above open) |
| 10/9 | Close Down |
Note: Changes to next day MMI signals occur about 5% of the time, and will be announced in updates as well as the daily report should they occur. Same day signals will not change. Day 2 and 3 signals reflect the most current information, and are subject to change. The default trade per the daily signals is executed at market on close. except on Mondays, as there is a signal for Monday open (i.e. "weekend close") and Monday close. The daily MMI signals are correct as daily direction calls about 63% of the time. Please manage your trading risk accordingly.
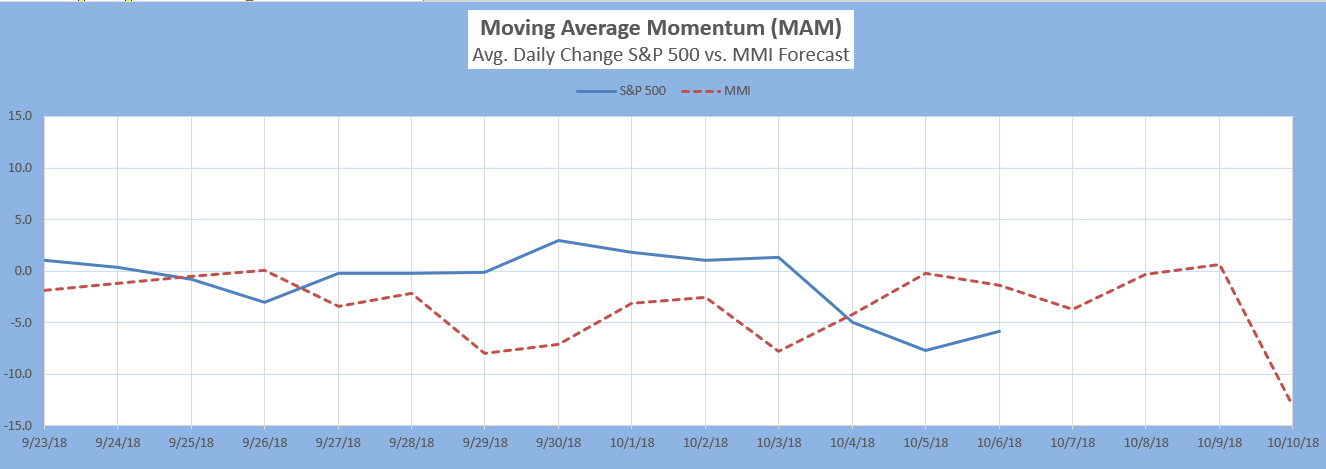
The Moving Average Momentum (MAM) Indicator last signaled a major trend change with a major LOW indication between April 18-25 (there was a closing low on the 25th which repeated slightly lower on May 3-- a major low).
The last few MAM signals (significant trend change, no direction specified) have only confirmed that the current move in the S&P is most likely an Elliott Wave diagonal.
New MAM signal: A significant trend change is likely Oct. 11-18. Direction is confirmed once market MAM < -10 or > 10. IF the market drops sufficiently during that time (market MAM < -10) this would indicate a major low. Direction not confirmed by a strong enough move either way would again simply reaffirm an EW diagonal in progress.
Intermediate Term Forecast:
The primary outlook is that a corrective move is in progress. Weekly charts are nearly flat over the next couple of weeks. Monthly charts show (roughly) October as a low.
MM MACD signal is unconfirmed SELL and the intermediate trend is UP. There is no swing trade signal.
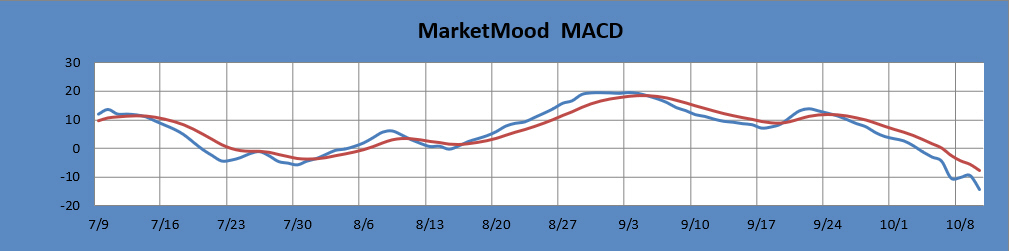
The MM MACD is similar to a standard MACD, except that it uses the MMI signal data to extend several days beyond today, while the standard MACD relies solely on historical market data.
Long Term Forecast:
The long term forecast remains strongly bullish. The bullish long term trend is indicated by the generally positive divergence between the stock market and the mood generated forecast (see long term chart below). The MM Long Term Trend Indicator (bottom chart) which is derived from this divergence, indicates: Bullish Trend, hold long positions. The MM LTTI has had this same bullish indication since 12 Sept., 2016.
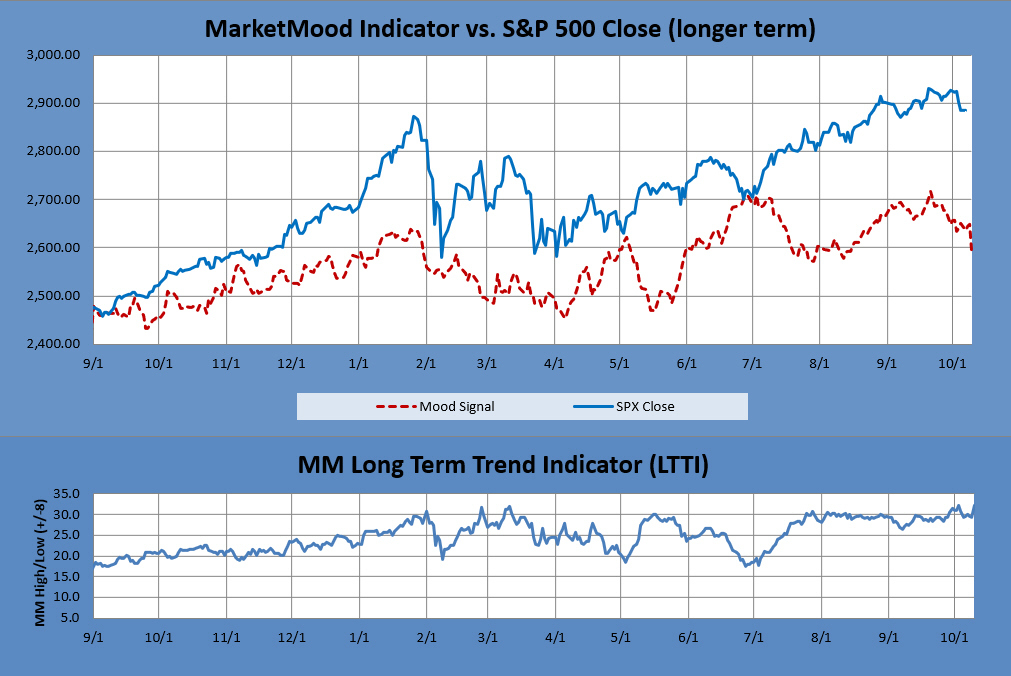
The MM LTTI measures trend strength using the divergence between the market trend and the forecast trend. A move above +8 or below -8 is bullish or bearish respectively. A value over 10 or under -10 followed by a move back through +/-8 signals a high or low is likely in. A subsequent move below +5 (or above-5) signals a trend change to bearish (or bullish).
