MarketMood Monday: Rumors of Progress?
 By
By
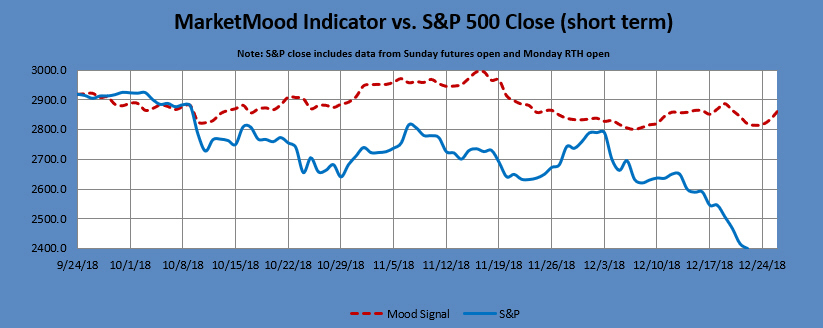
Where We've Been:
The mood pattern for the weekend is complex with the 3 day "panic" pattern completing on Saturday. Sunday is now a signal flip day with the day starting as "letting go" and ending as "bad news." MMI is a turbulent down for Monday open.
MMI for Monday open: down
Where We're Heading:
Monday's mood pattern implies government intervention of some type (usually intervention after a crisis or disaster) and Monday's MMI is pointing up. It's difficult to imagine much coming from the government (U.S. or otherwise) when most everyone is out for the holidays, but perhaps a rumor of progress could suffice.
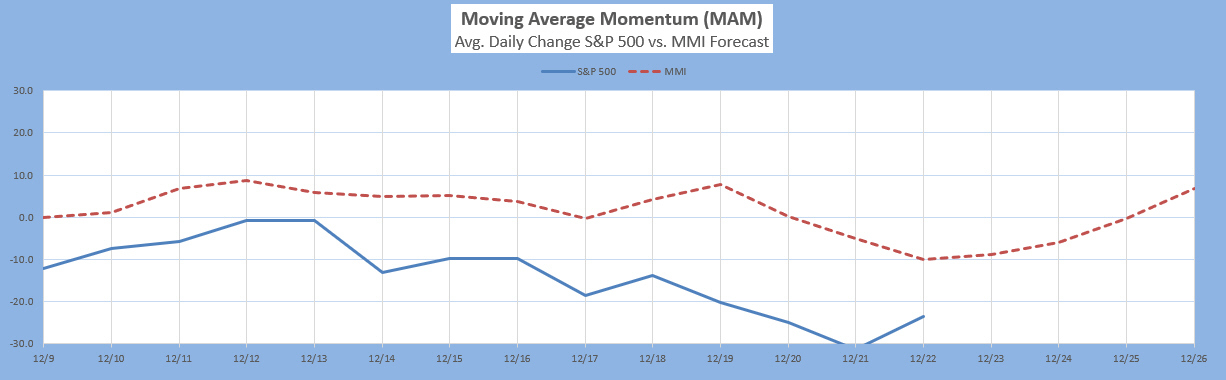
The MAM is showing an extremely oversold condition which would support a bounce should it occur. The MAM has issued a major low signal for December 24-31. Also, the MM MACD, while not currently issuing any specific swing trade signal has a very bullish look to it (see below).
MMI for Monday: close up (above open)
MarketMood Data Info:
Internet search theme MMI inputs (mood vs effect inverted): winter, nature, men, sports, military, leader, resign, protest, donations, international, security, wall, government, disruption
Short Term Forecast:
Next 3 Days:
| Date | Daily MMI |
|---|---|
| 12/24 (open) | down |
| 12/24 | close up |
| 12/26 (open) | up |
Note: Changes to next day MMI signals occur about 5% of the time, and will be announced in updates as well as the daily report should they occur. Same day signals will not change. Day 2 and 3 signals reflect the most current information, and are subject to change. The default trade per the daily signals is executed at market on close. except on Mondays, as there is a signal for Monday open (i.e. "weekend close") and Monday close. The daily MMI signals are correct as daily direction calls about 63% of the time. Please manage your trading risk accordingly.
The Moving Average Momentum (MAM) Indicator's last major high signal was 11/1-9. The closing high on 11/7 fulfilled that. The last major low signal was 11/20-30. The market rallied 5% over 10 days from the closing low on Nov. 23, but subsequent market action has invalidated the "major" part of the call).
In addition to an extremely oversold signal, there is a new MAM major low signal for Dec. 24-31.
Intermediate Term Forecast:
The primary outlook is that a corrective move is in progress. Weekly charts imply a bounce at any time within an overall downtrend. Monthly charts show a slight downward bias through February (this does not rule out both strong selloffs and rallies during this period), followed by a sharp upturn. This would imply a low in the February/March time frame.
MM MACD signal is unconfirmed BUY and the intermediate trend is DOWN. There is no swing trade signal.
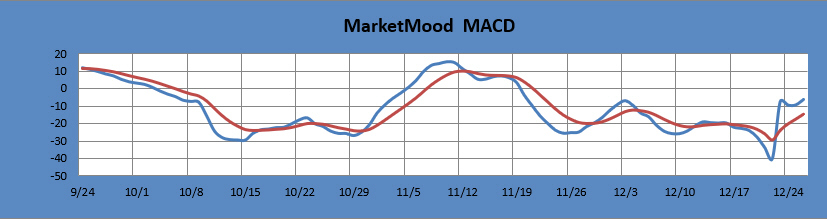
The MM MACD is similar to a standard MACD, except that it uses the MMI signal data to extend several days beyond today, while the standard MACD relies solely on historical market data.
Long Term Forecast:
The long term forecast has turned from bullish to neutral after a two year and 400 hundred point SPX run. The long term trend is indicated by the general divergence between the stock market and the mood generated forecast (see long term chart below). The MM Long Term Trend Indicator (bottom chart) which is derived from this divergence, indicates: Neutral Trend, exit long positions. The MM LTTI has had this indication since 20 Dec., 2018.
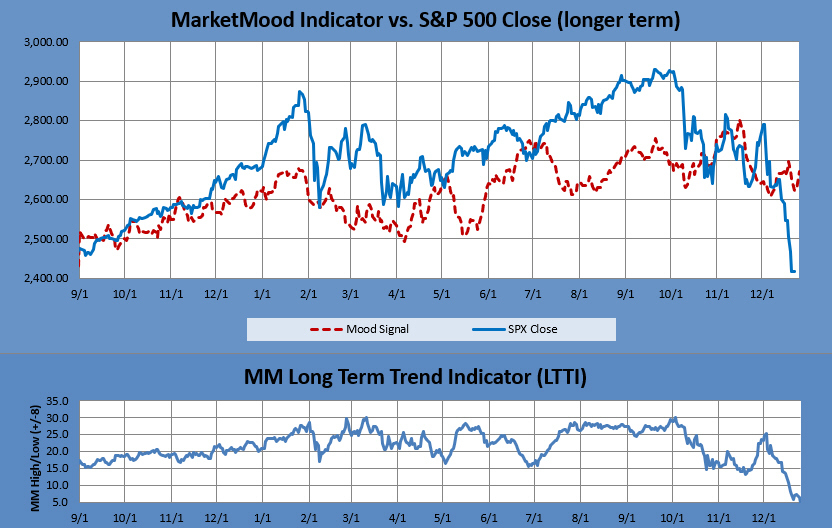
The MM LTTI measures trend strength using the divergence between the market trend and the forecast trend. A move above +8 or below -8 is bullish or bearish respectively. A value over 10 or under -10 followed by a move back through +/-8 signals a high or low is likely in. A subsequent move below +5 (or above-5) signals a trend change to bearish (or bullish).
