MarketMood Monday: Reflecting on the Moment
 By
By
Where We've Been:
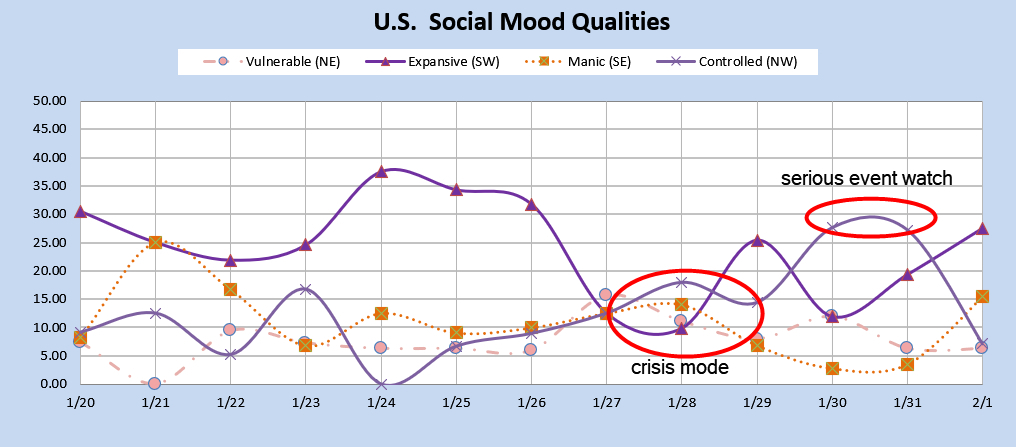
The mood pattern for the weekend reflects a "crisis mode" of some type. It could be accounted for by the strong emotional reactions to the video release of the beating of Tyre Nichols and law enforcement being on alert just in case there is any sign of things getting out of hand. MMI is down for Monday RTH open.
Indicator changes: MM Trend Trader's higher probability signal likely to return to bullish from neutral at RTH open; Intermediate trend would then return to "bullish" from "ambiguous, bullish."
Where We're Heading:
The mood pattern for Monday/Tuesday reflects somber themes and a focus on governmental, police, and/or legal matters. MMI for Monday is down and for Tuesday and Wednesday, it's up.
MM Trend Trader's higher probability signal is looking likely to turn back to bullish at RTH open on Monday. LTTI is very near signaling a moderation of the "strong bearish" trend to "bearish" and may do so on Monday.
Latest charts follow the summary tables.
Internet search theme source data for MMI input: man, violence, death, remembered, police, legal, consequences, family, video, tension
Next 3 Days (days 2 and 3 are considered preliminary):
| Date | Daily MMI | CDMS* |
|---|---|---|
| 1/30 (open) | Down | ------- |
| 1/30 | Down | No Trade |
| 1/31 | Up | Intraday Buy |
| 2/1 | Up | Intraday Buy |
*Composite Daily Mood Signal (CDMS) combines the MMI daily signal and the various MM trend and trading indicators into one overall daily trade signal. Possible signals are intraday buy, daily buy, no trade, intraday sell, and daily sell. An "intraday" signal is more likely to be a mixed day, so the implied strategy is to watch for day trade setups in the indicated direction during the trading day. A "daily" signal points to less cross-currents and an implied strategy of entering at market close for the next day's trade.
MM Indicators and Trading Parameters Summary:
| Indicator | Scope | Reading |
|---|---|---|
| LTTI | Longer Term Trend | Strong Bearish |
| MMTT (main) | Medium Term Trend | Bullish > 4037 |
| MMTT (HP) | Medium Term Trend | Ambiguous |
| MMTT (b/b) | Bull/Bear Trend Line | 4037 (SPX cash) |
| Hi/Lo Trader | Medium Term Trend Change | N/A |
| MM MACD | Swing Trade | Neutral |
| MAM | 7 Day Moving Average | Mildly Overbought |
Note: Medium term (MMTT and Hi/Lo) is roughly 1 week to 2 months. Longer term (LTTI) is roughly 1 month to a year or more. Swing (MM MACD) is 1 – 3 days or more.
TRADING STRATEGIES: Per LTTI, long term traders would be holding short. There is no specific guidance for shorter term traders at this time.
Current Hypothetical Trades per above strategies (your exact entry points may differ):
| Term | B/S | Date In | SPX cash at Entry | Action |
|---|---|---|---|---|
| Long | S | 4/22/22 | 4272 | Hold |
| Swing | ||||
| Day |
Short Term Charts and Indicators:
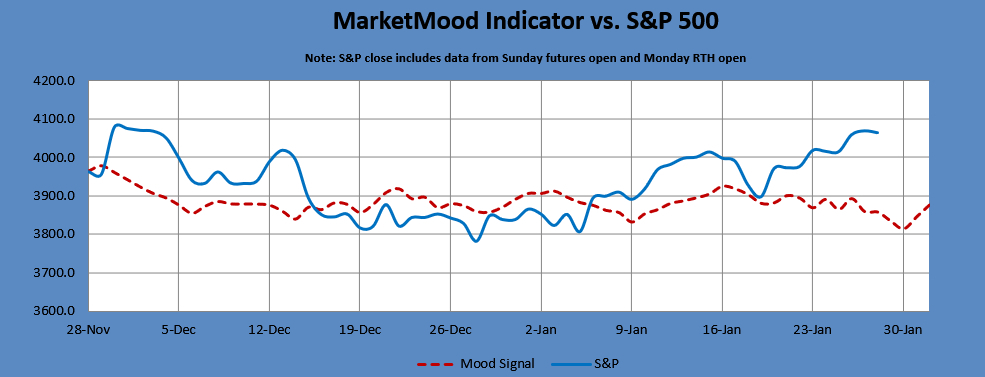
MMI vs. S&P 500 daily:
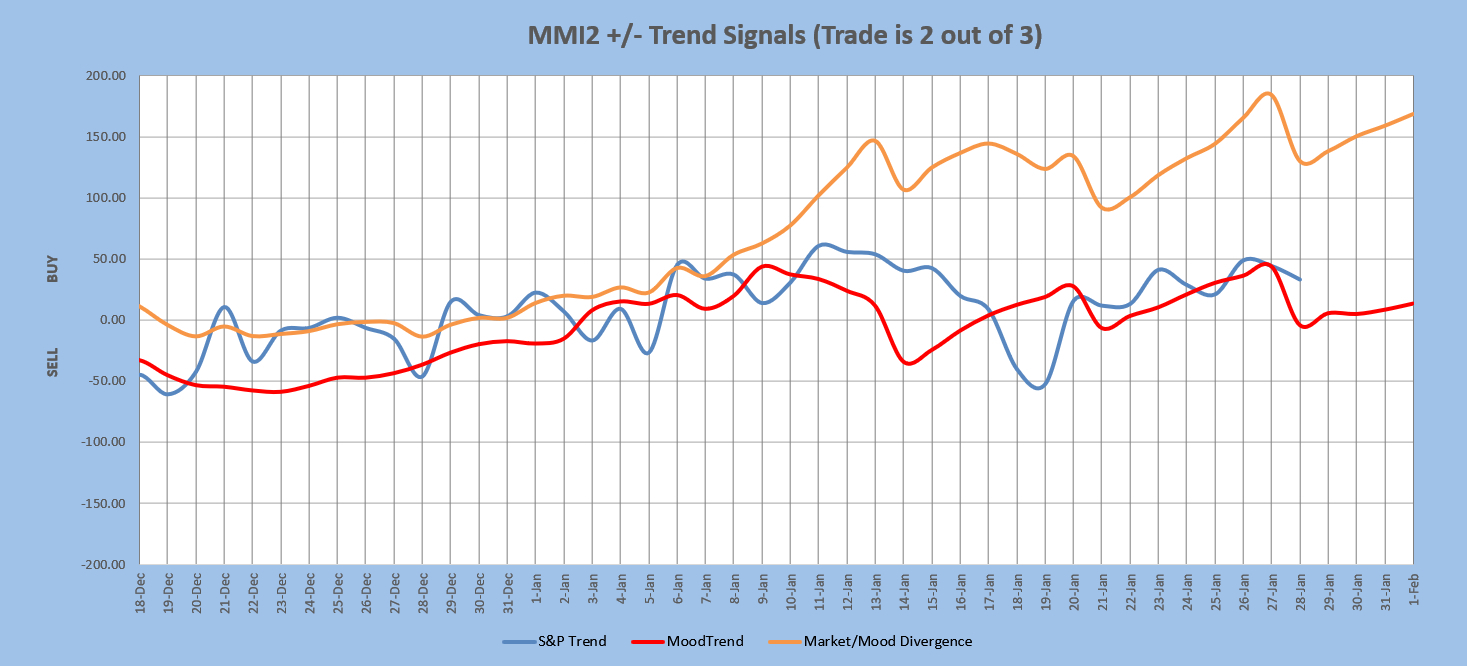
MMI2 vs S&P 500 daily:
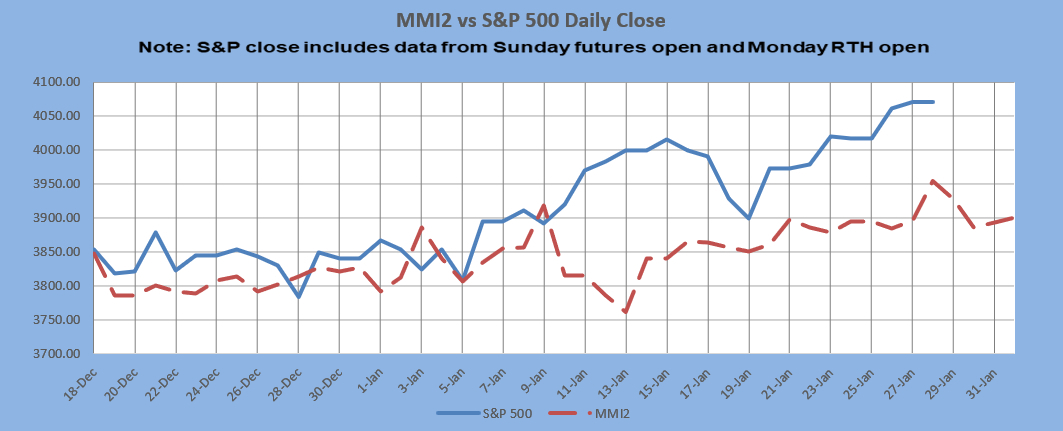
** MMI 2 uses an alternate dynamic algorithm to convert the same sentiment source data to S&P direction that the original MMI algorithm uses.
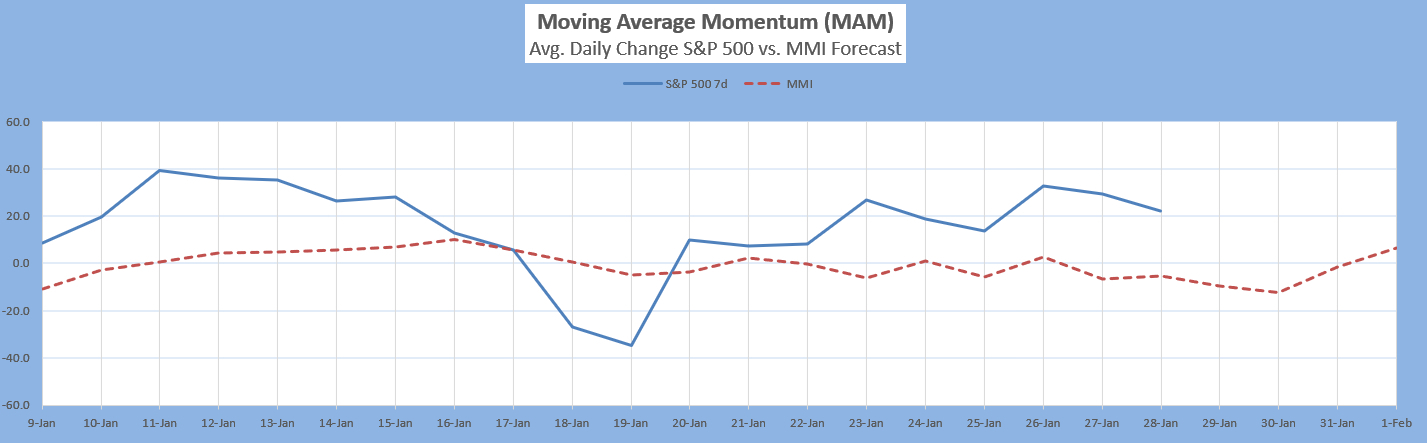
The Moving Average Momentum (MAM): The last confirmed MAM major low signal was for Mar. 3-Mar. 18, 2022, with the low on Mar. 8 followed by a 10% rally. The last major low signal on Sept. 20 - 27, 2022 was invalidated on Sept. 29, implying more downside yet to come. The market made a low on Sept. 30, bounced, and then made a lower low on Oct. 13. It rallied 8% from there. The last major high signal was for July 6-13, 2022. The high on July 7 was followed by a smaller than usual 3% decline on the S&P 500.
Current status: mildly overbought
MM MACD signal is unconfirmed sell and the swing level trend (per MMI vs S&P 500) is up. There is no swing trade signal at this time.
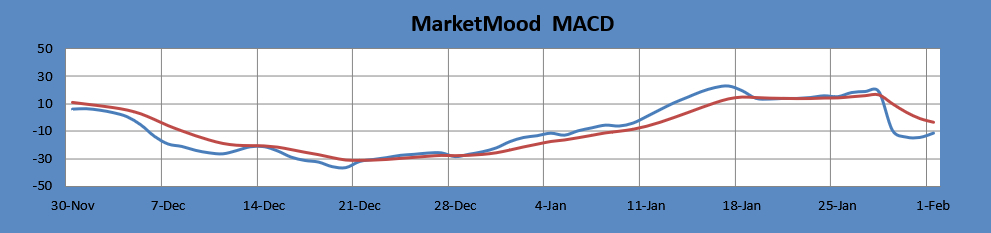
The MM MACD is similar to a standard MACD, except that it uses the MMI signal data to extend several days beyond today, while the standard MACD relies solely on historical market data.
Intermediate Term Forecast:
The general outlook for the first few months of 2023 is a whipsaw-prone, primarily down market that finally finds a low. It then should turn strongly higher through at least Q2, and possibly for the year. There is no sustainable low yet detected in the longer term daily MMI derived indicators. However, there is the potential for a strong upturn showing in the weekly charts as the month of February begins (watching for a pullback first).
MarketMood Trend Trader
The chart below uses three sentiment trend lines to generate a swing trade signal of BUY if 2 out of 3 are greater than 0 and SELL if 2 out of 3 are less than 0. Trade length averages 9 days, but can be as short as 1 and has been as long as 60. The signal is updated each day after market close. Note: because this is a trend trader it is not recommended for trading during periods of little to no definitive trend.
Current signal: Buy since Jan. 6. HP signal: Neutral since Jan. 27.
Major Hi/Lo Trader (this averages just a few trades a year):
There are no current trades.
A write-up explaining major highs and lows can be found here along with system backtesting data (latest revision Dec. 2022). There is no price target. It goes until there is an exit signal or a stop out.
Long Term Forecast:
The long term trend is indicated by the general divergence between the stock market and the mood generated forecast (see long term chart below). The MM Long Term Trend Indicator (lower chart) which is derived from this divergence, indicates: "Strong Bearish Trend, hold bearish long-term positions." The MM LTTI has had this indication since 26 Apr. 2022. It was previously "Bearish" from 22 Apr. 2022.
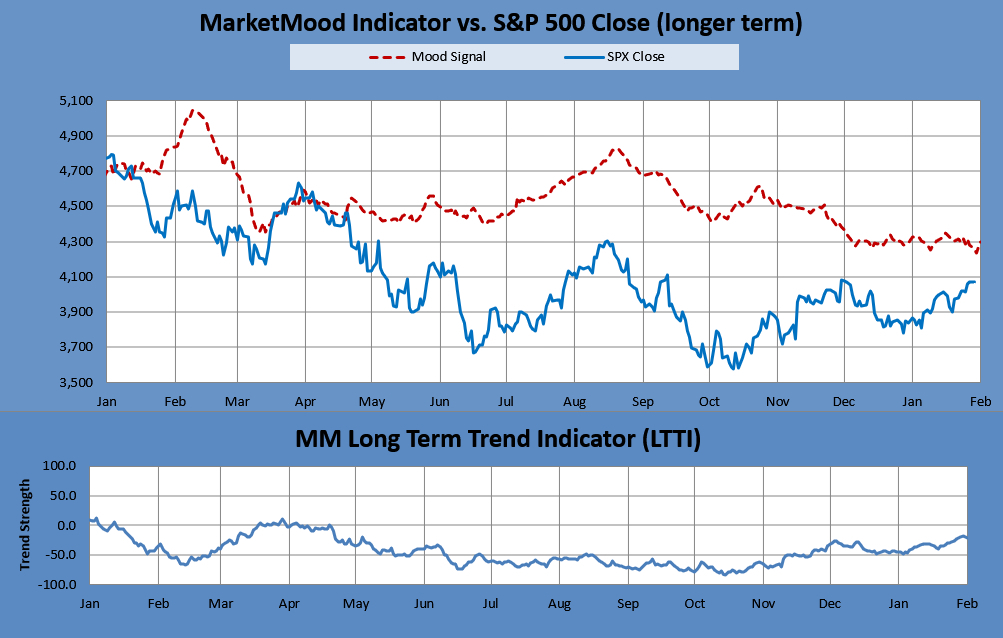
The MM LTTI measures trend strength using the divergence between the market trend and the forecast trend.
For the Extremely Curious:
In normal mode, the top of the mood chart is primary, and in inverted mode the bottom of the chart is. Orientation is currently assumed to be normal mode.
1/28-29: Controlled-Manic in parallel implies "crisis mode"
1/30: High Controlled, low Manic generates a "serious event watch;" with the addition of Expansive/Vulnerable together, a "natural event watch."
Tomorrow's market mood and news: somber themes, government/legal matters
Tomorrow's trader context: letting go, moving on, grief
Limitations:
MMI does least well in these conditions-- 1) EW 4th wave, 2) EW b wave, 3) Diagonals, and 4) Topping. More than one of these conditions concurrently present will further diminish performance.
Note: Changes to next day MMI signals occur about 5% of the time, and will be announced in updates as well as the daily report should they occur. Same day signals will not change. Day 2 and 3 signals reflect the most current information, and are subject to change. The default timeframe covered by the daily signals is market close to market close. except on Mondays, as there is a signal for Monday open (i.e. "weekend close") and Monday close.
