MarketMood Monday: A New Thing Happening
 By
By
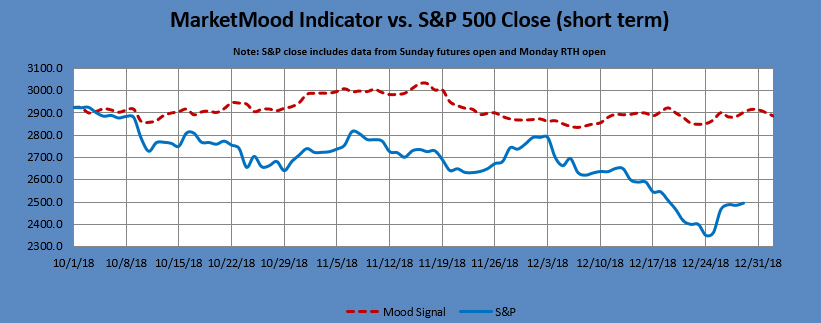
Where We've Been:
The weekend MMI (Monday open) is the opposite of however Friday actually closed, so MMI is looking for a positive open on Monday. The mood pattern however, suggests a cautious approach as Sunday's pattern implies negatively perceived news, data, or facts, and the weekend as a whole usually accompanies government related instability, victimization, or risk averse sentiment. It's possible that the market shrugs off any of this, but it's worthy of note that the weekend sentiment is anything but optimistic.
MMI for Monday open: up (caution advised)
Where We're Heading:
Monday's MMI is not exceedingly helpful. It's pointing slightly down, but it's derived from a mood pattern that means "new paradigm," yet has no directional bias. We can look for something new happening on Monday-- perhaps the approaching New Year?
The MMI for 1/2 open and 1/2 both depend on Monday's close (relative to Monday open) and be the opposite.
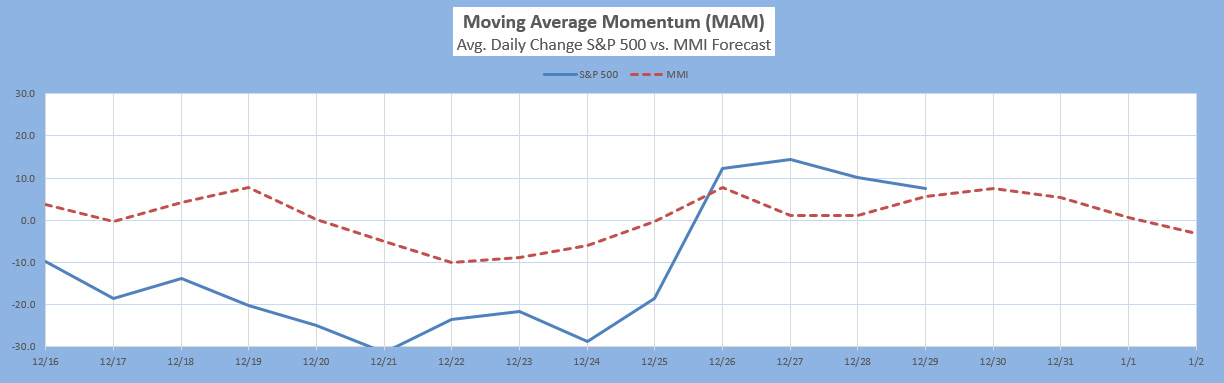
The MAM has issued a major low signal for December 24-31. If this low is not already in, it would be expected by early this week.
MMI for Monday: close down (below open)
MarketMood Data Info:
Internet search theme MMI inputs (mood vs effect inverted): technology, disruption, infrastructure, man, suicide, drugs, movie, interactive
Short Term Forecast:
Next 3 Days:
| Date | Daily MMI |
|---|---|
| 12/31 (open) | up |
| 12/31 | close down |
| 1/2 (open) | opposite of 12/31 close |
Note: Changes to next day MMI signals occur about 5% of the time, and will be announced in updates as well as the daily report should they occur. Same day signals will not change. Day 2 and 3 signals reflect the most current information, and are subject to change. The default trade per the daily signals is executed at market on close. except on Mondays, as there is a signal for Monday open (i.e. "weekend close") and Monday close. The daily MMI signals are correct as daily direction calls about 63% of the time. Please manage your trading risk accordingly.
The Moving Average Momentum (MAM) Indicator's last major high signal was 11/1-9. The closing high on 11/7 fulfilled that. The last major low signal was 11/20-30. The market rallied 5% over 10 days from the closing low on Nov. 23, but subsequent market action has invalidated the "major" part of the call).
The current MAM major low signal is for Dec. 24-31. If this low is not already in, it would be expected (per the signal) by early this week.
Intermediate Term Forecast:
The primary outlook is that a corrective move is in progress. Weekly charts imply a bounce completing shortly and downtrend resuming. Monthly charts show a slight downward bias through February (this does not rule out both strong selloffs and rallies during this period), followed by a sharp upturn. This would imply a low in the February/March time frame.
MM MACD signal is unconfirmed BUY and the intermediate trend is DOWN. There is no swing trade signal.
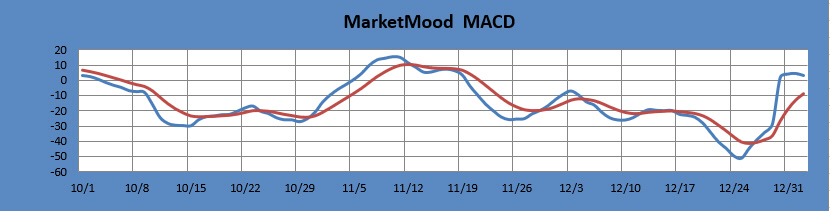
The MM MACD is similar to a standard MACD, except that it uses the MMI signal data to extend several days beyond today, while the standard MACD relies solely on historical market data.
Long Term Forecast:
The long term forecast has turned bullish from neutral. Since a two year bullish trend has recently concluded, the trend may now vacillate between bearish, neutral and bullish for a bit before firmly deciding on its long term trend. The long term trend is indicated by the general divergence between the stock market and the mood generated forecast (see long term chart below). The MM Long Term Trend Indicator (bottom chart) which is derived from this divergence, indicates: Bullish Trend, enter bullish long term positions. The MM LTTI has had this indication since 27 Dec., 2018.
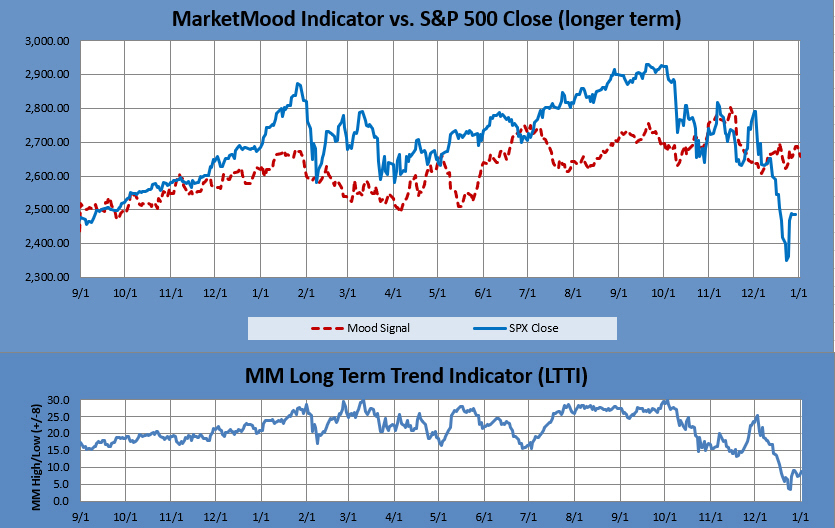
The MM LTTI measures trend strength using the divergence between the market trend and the forecast trend. A move above +8 or below -8 is bullish or bearish respectively. A value over 10 or under -10 followed by a move back through +/-8 signals a high or low is likely in. A subsequent move below +5 (or above-5) signals a trend change to bearish (or bullish).
