MarketMood Friday: What Will the Bears Do with this One?
 By
By
Where We've Been:
Today's mood pattern reflected topping and MMI was pointing up. Once again, I was skeptical that it would stay up through end of day, and once again the market managed it. Perhaps my skepticism is a contra- indicator, lol.
Today's trader mood context was: "shifting situations"
Today's trader mood challenge was: "quiet, staying calm"
Where We're Going
The mood pattern for Thursday and Friday is a combination topping pattern and slight bearishness. MMI is looking down for Thursday (Friday open). Friday's MMI will be in the same direction that it opens relative to Wednesday's close. The bears should get another chance here, but the question is, what will they do with it? They've been pretty timid for some time.
Friday's trader mood context: "decision time"
Friday's trader mood challenge: "financial issues, domestic matters"
MMI Friday: close same direction as open
MarketMood Data Info:
Internet search theme MMI inputs: men, sports, winners, business, calendar, sale, woman, music, TV
Short Term Forecast:
Next 3 Days:
| Date | Daily MMI | MMI 2* |
|---|---|---|
| 11/29 (open) | down | - |
| 11/29 | Same as 11/29 open | - |
| 12/2 (open) |
*MMI 2 uses an alternate algorithm to convert the same sentiment source data to S&P direction.
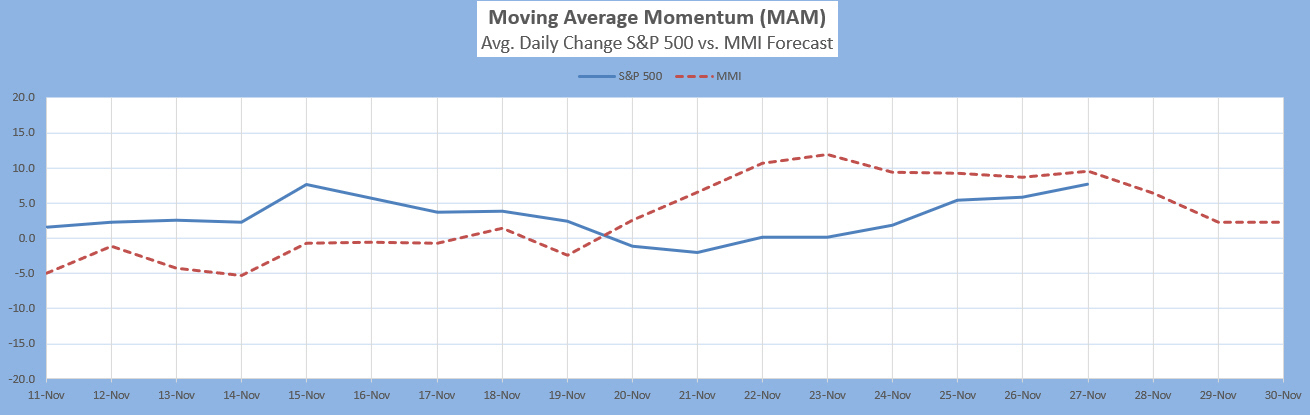
The Moving Average Momentum (MAM) Indicator's last major high signal was 11/1-9, 2018. The closing high on 11/7 fulfilled that. The last major low signal was 12/24-31, 2018. The market rallied strongly after the close on Dec. 24 which fulfilled the major low signal.
Current Signal: There is a new MAM significant trend change signal for November 22-Dec. 2. Direction is not yet confirmed. If there is a strong enough rally in this window, it would signal a major high (not looking likely). A strong enough drop would signal a local low. No confirmation at all would imply an EW diagonal is likely in play.
Intermediate Term Forecast:
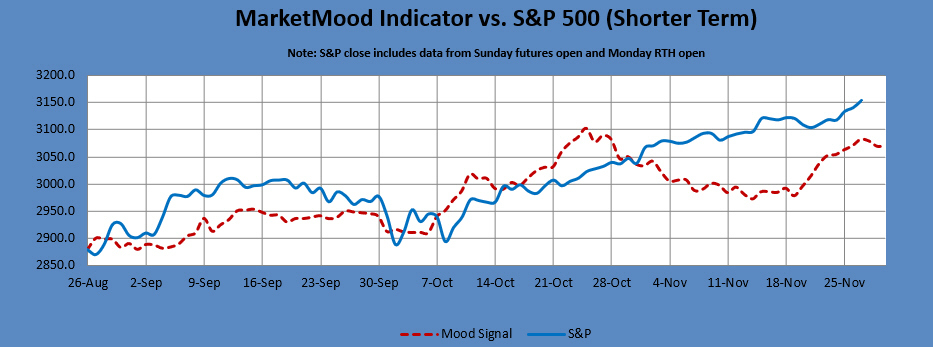
The weekly MMI vs SPX chart implies a market that's been ready to drop for some time, and is showing a local low early December. The monthly chart shows a corrective decline through January or early February.
MM MACD signal is confirmed buy and the intermediate trend is UP. The swing trade signal is buy at or above 3158 SPX.
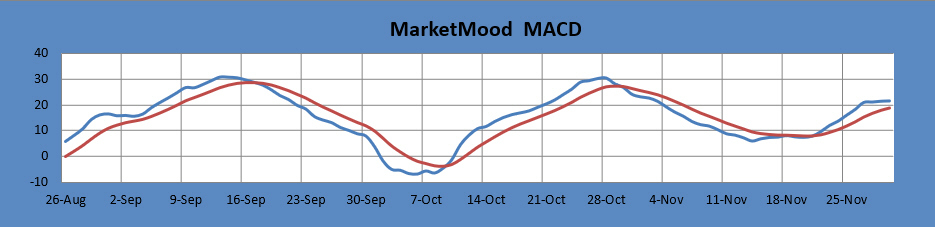
The MM MACD is similar to a standard MACD, except that it uses the MMI signal data to extend several days beyond today, while the standard MACD relies solely on historical market data.
Long Term Forecast:
The long term trend indicator (LTTI) continues in bullish trend / topping mode. The long term trend is indicated by the general divergence between the stock market and the mood generated forecast (see long term chart below). The MM Long Term Trend Indicator (bottom chart) which is derived from this divergence, indicates: "Bullish Trend, Hold long long-term positions." The MM LTTI has had this indication since 13 Feb 2019.
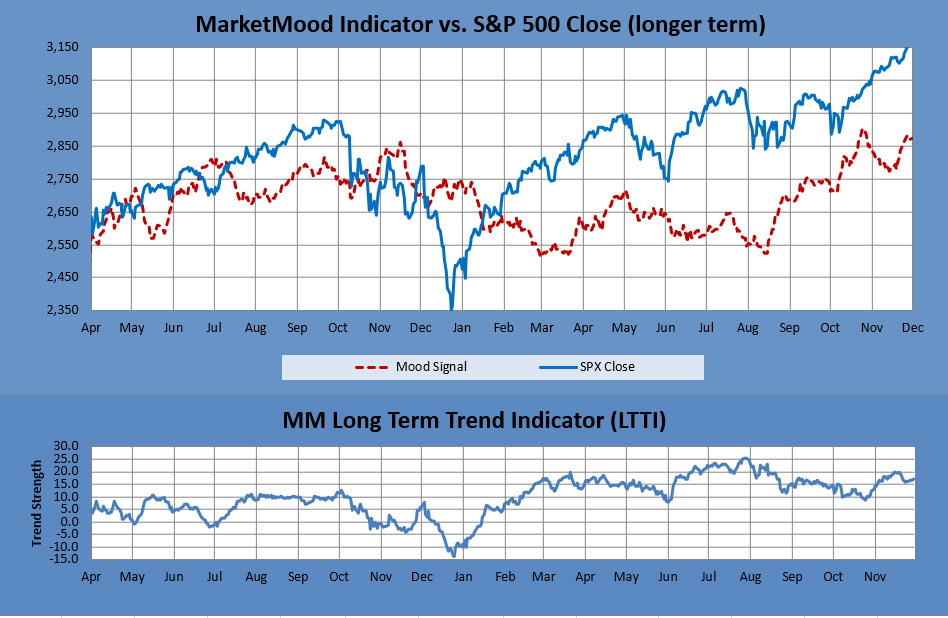
The MM LTTI measures trend strength using the divergence between the market trend and the forecast trend.
Recent Performance:
MMI recent performance relative to a long term average of over 60% correct daily up or down calls indicates how closely it's been tracking with the market near term. In the basic daily performance stats below, posted signal flip days aren't counted in the total as there is no call on those days as to a positive or negative close. Monday open does count as a call unless it's part of a flip.
Note: MMI does least well in these conditions-- 1) EW 4th wave, 2) EW b wave, 3) Diagonals, and 4) Topping. More than one of these conditions concurrently present will further diminish performance.
This week so far: 4/4 calls correct (100%) Up calls 4/4 (100%), Down calls NA.
Last week: 3/5 calls correct (60%) Up calls 2/4 (50%), Down calls 1/1 (100%).
November so far: 11/18 calls correct (61%). Up calls 8/12 (67%), Down calls 3/6 (50%).
October: 12/24 calls correct (50%). Up calls 8/14 (57%), Down calls 4/10 (40%).
Note: Changes to next day MMI signals occur about 5% of the time, and will be announced in updates as well as the daily report should they occur. Same day signals will not change. Day 2 and 3 signals reflect the most current information, and are subject to change. The default trade per the daily signals is executed at market on close. except on Mondays, as there is a signal for Monday open (i.e. "weekend close") and Monday close. The daily MMI signals are correct as daily direction calls about 63% of the time. Please manage your trading risk accordingly.
