MarketMood Friday: Is There Another Shoe?
 By
By
Where We've Been:
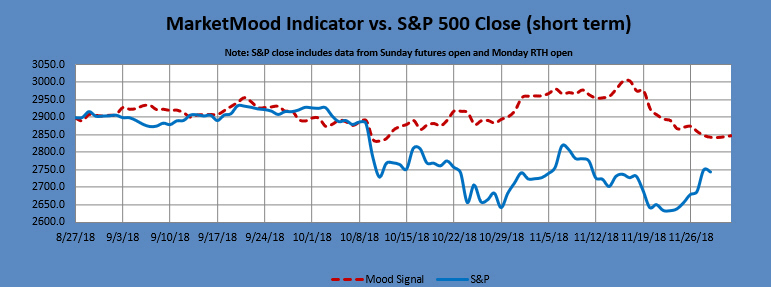
Thursday's MMI had a slight edge towards down, but was primarily a breakout or breakdown pattern. There was also a mix of positive and negative factors today adding choppiness and confusion. There was the bullish multi-day government intervention component continuing from yesterday. On the bearish side, the MAM had issued an overbought or imminent pullback signal. Also, on the bearish side was a "Tuesday-Wednesday" bullish exhaustion mood component which tends to be immediately followed by a pullback. The market did technically break out of a range, but after yesterday's big move, all it could muster was a brief peek above Wednesday's high.
MMI for Thursday was: breakout or breakdown, slight down bias. S&P 500 closed -0.22%
Where We're Heading:
Friday's MMI is ambivalent. The mood pattern portrays "breath holding," a serious tone, seeking balance, and probably is related to the G20 summit. Perhaps there's concern that "another shoe" will drop. The MAM continues with an overbought or imminent pullback signal. The MM MACD also continues in swing sell mode. The weekend MMI is pointing up for Monday open.
MMI for Friday: ?
MarketMood Data Info:
Internet search theme MMI inputs: international, woman, doctor, remembered, space, planet, success, technology, man, creative, tv, death
Short Term Forecast:
Next 3 Days:
| Date | Daily MMI |
|---|---|
| 11/30 | ? |
| 12/3 (open) | up |
| 12/3 |
Note: Changes to next day MMI signals occur about 5% of the time, and will be announced in updates as well as the daily report should they occur. Same day signals will not change. Day 2 and 3 signals reflect the most current information, and are subject to change. The default trade per the daily signals is executed at market on close. except on Mondays, as there is a signal for Monday open (i.e. "weekend close") and Monday close. The daily MMI signals are correct as daily direction calls about 63% of the time. Please manage your trading risk accordingly.
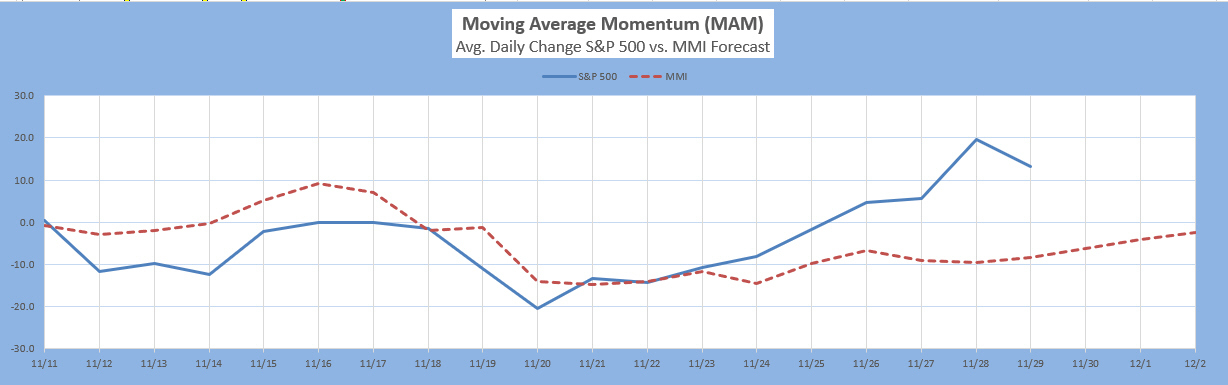
The Moving Average Momentum (MAM) Indicator last two major low signals resulted in significant rallies, but did not hold as major lows in the specified time frames. One (April 18-25) was followed by a major low a week later (May 3). For the other one (Oct. 11-18), a major low was struck 11 days after the signal window on Oct. 29.
The latest MAM major high signal was 11/1-9. The closing high on 11/7 fulfilled that.
There is a current MAM major (closing) low signal for Nov. 20-30 (if not already in). The last low was Nov. 23.
There is also an overbought signal (market > 10 MAM) meaning an immediate pullback is anticipated.
Intermediate Term Forecast:
The primary outlook is that a corrective move is in progress. Weekly charts show a near term low is in. Monthly charts are relatively flat through January (this can include both large drops and sharp upward reversals). Charts show a slight upward bias to November, and slight downward bias to both December and January).
MM MACD signal is confirmed SELL and the intermediate trend is DOWN. The swing trade signal is continued SELL from 2776.
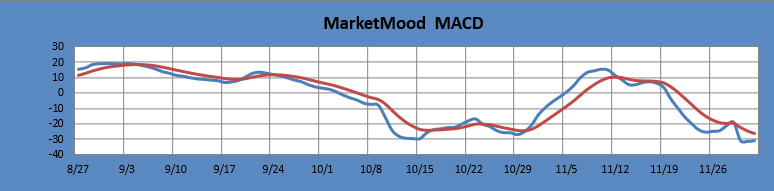
The MM MACD is similar to a standard MACD, except that it uses the MMI signal data to extend several days beyond today, while the standard MACD relies solely on historical market data.
Long Term Forecast:
The long term forecast remains bullish, but the trend has weakened substantially over the last few months. The bullish long term trend is indicated by the generally positive divergence between the stock market and the mood generated forecast (see long term chart below). The MM Long Term Trend Indicator (bottom chart) which is derived from this divergence, indicates: Bullish Trend, hold long positions. The MM LTTI has had this same bullish indication since 12 Sept., 2016.
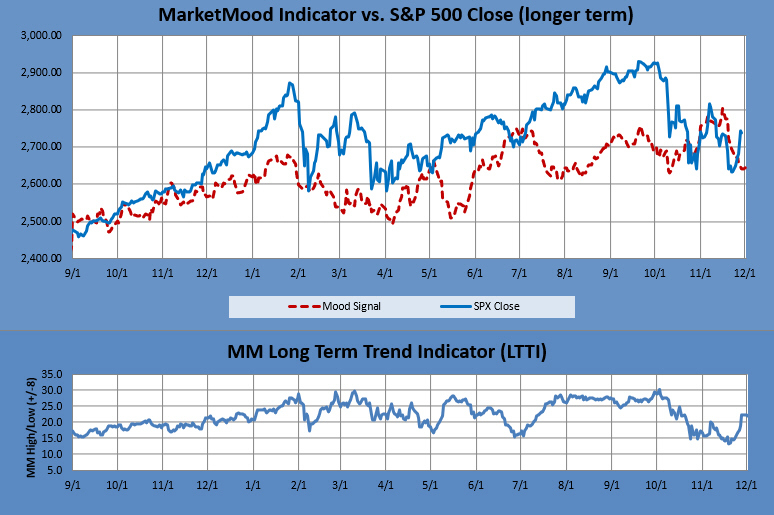
The MM LTTI measures trend strength using the divergence between the market trend and the forecast trend. A move above +8 or below -8 is bullish or bearish respectively. A value over 10 or under -10 followed by a move back through +/-8 signals a high or low is likely in. A subsequent move below +5 (or above-5) signals a trend change to bearish (or bullish).
