MarketMood Friday: Global "Earthquakes"
 By
By
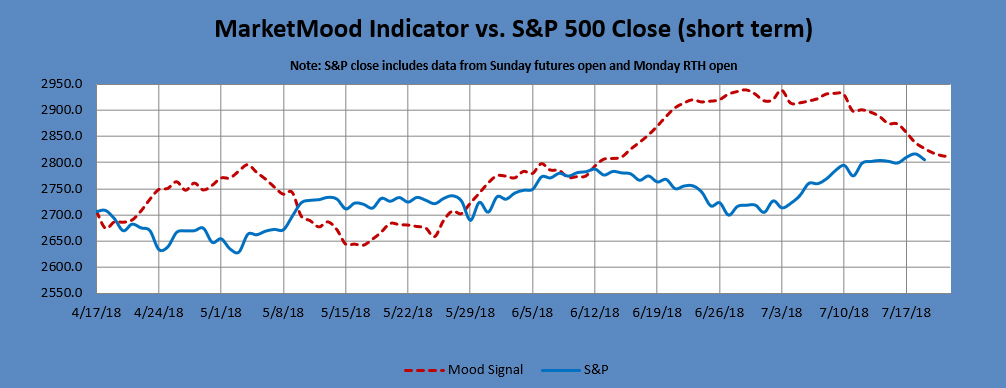
Thursday's mood pattern was day 1 of 2 days reflecting government-related instability or geopolitical issues. The S&P 500 started down early then meandered much of the day. Trump's comments on the Fed and interest rates were icing on the cake and right on target with the mood pattern.
Our MarketMood Indicator (MMI) indicated a close down for the day, and the S&P 500 closed down -0.4%.
Our MMI is also looking down for Friday, as the second day of 2 days reflecting government-related instability or geopolitical issues, which also is the main theme in the weekly mood pattern through next week.
The Internet search theme MMI inputs are men, president, controversy, talk, and sports.
Something different is showing up for the weekend (Monday open). The mood pattern is a combination of bullish trend and strong emotions. MMI calculates it as down, but caution is advised due to the "bullish trend" component.
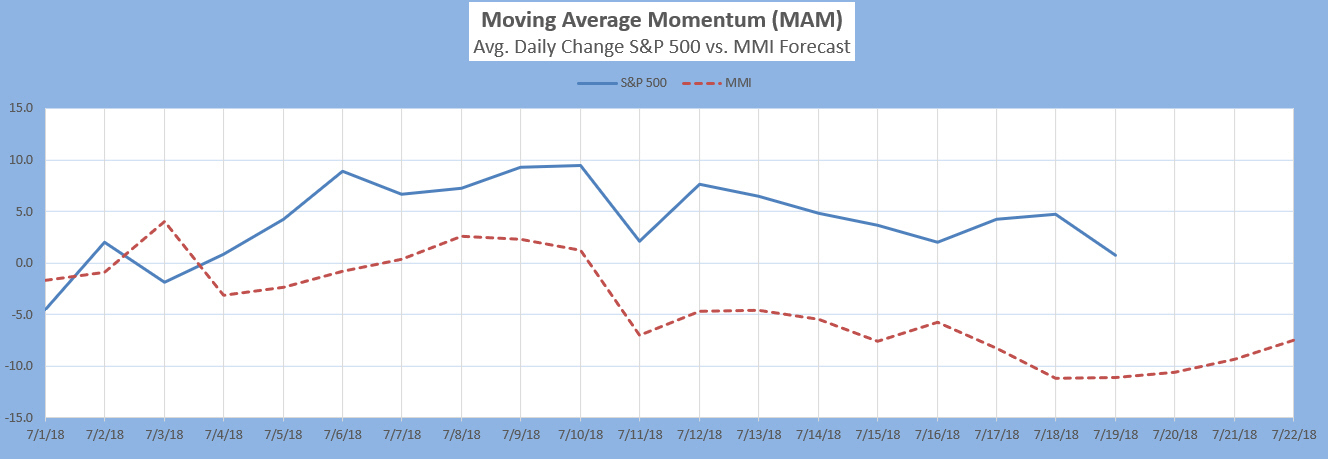
Also note that our Moving Average Momentum (MAM) indicator is pointing to a significant trend change July 18-27 with a preliminary indication of a significant low during that period.
The MAM indicator last signaled a major trend change with a major LOW indication between April 18-25 (there was a closing low on the 25th which repeated slightly lower on May 3-- a major low).
The MAM has signaled a significant trend change, direction not yet indicated, but likely down, July 18-27 (significant means noticeable, but may not be long lasting). It has also given a preliminary signal for a major LOW which will first need to confirmed by a strong downward move during this same time period.
Intermediate-term, the primary outlook is that a corrective move is in progress. Weekly charts are looking for at least a brief resumption of downside. Monthly charts show a trendchange (likely from a low) in July.
Our MM MACD signal is SELL, and the intermediate trend is DOWN. The swing trade signal continues to be SELL (at or below 2800 SPX for new positions).
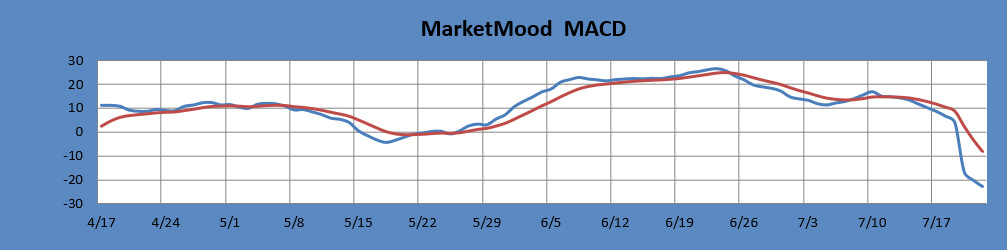
The MM MACD is similar to a standard MACD, except that it uses the MMI signal data to extend several days beyond today, while the standard MACD relies solely on historical market data.
The long term forecast remains bullish. The bullish long term trend is indicated by the generally positive divergence between the stock market and the mood generated forecast (see long term chart below). The MM Long Term Trend Indicator (bottom chart) which is derived from this divergence, indicates a bullish trend, hold long positions. The MM LTTI has had this same bullish indication since September 12, 2016.
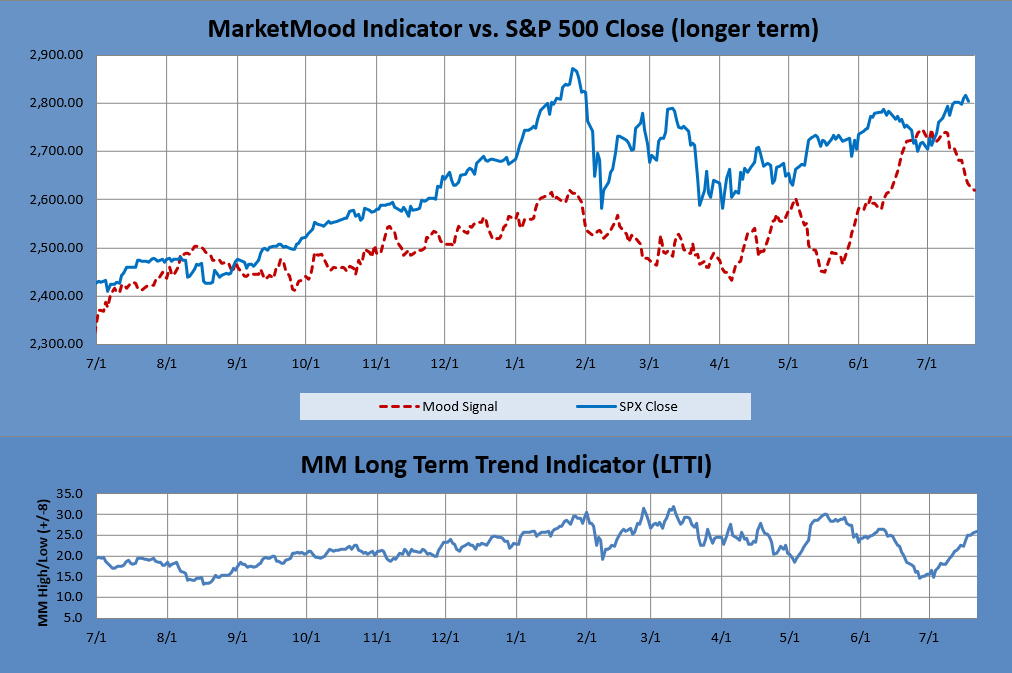
The MM LTTI measures trend strength using the divergence between the market trend and the forecast trend. A move above +8 or below -8 is bullish or bearish respectively. A value over 10 or under -10 followed by a move back through +/-8 signals a high or low is likely in. A subsequent move below +5 (or above-5) signals a trend change to bearish (or bullish).
