MarketMood Friday: Fireworks and Feelings
 By
By
Where We've Been:
MMI for Wednesday was up, and bulls should have given it everything they had left as another back to back "bullish exhaustion" pattern played out. The market closed up strongly, especially for a short pre-holiday session.
Today's trader mood context was: "hanging in there"
Today's trader mood challenge was: "looking over the horizon"
Where We're Going
The mood pattern for Thursday goes with explosions and military activity. Yet, it's the 4th of July and fireworks are expected, as well as tanks in Washington D.C. Friday's pattern is highly emotional. For the markets, Thursday's MMI (Friday open) is down and Friday's is down.
MMI Friday: close down
Tomorrow's trader mood context: "adventure, far away"
Tomorrow's trader mood challenge: "serious issues, responsibilities"
MarketMood Data Info:
Internet search theme MMI inputs: trade, contract, man, sports, death, body, police, women, international
Short Term Forecast:
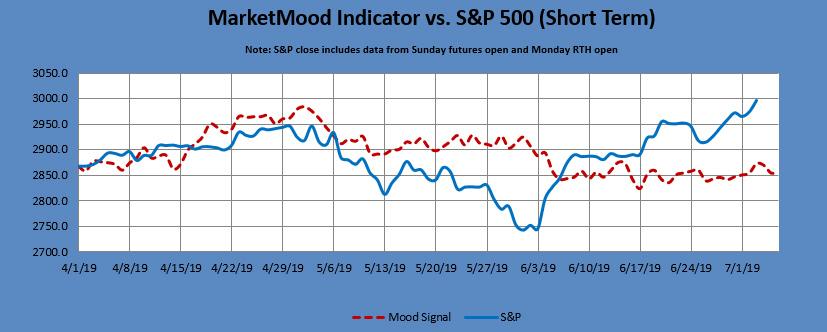
Next 3 Days:
| Date | Daily MMI |
|---|---|
| 7/5 (open) | down |
| 7/5 | close down |
| 7/8 (open) |
Note: Changes to next day MMI signals occur about 5% of the time, and will be announced in updates as well as the daily report should they occur. Same day signals will not change. Day 2 and 3 signals reflect the most current information, and are subject to change. The default trade per the daily signals is executed at market on close. except on Mondays, as there is a signal for Monday open (i.e. "weekend close") and Monday close. The daily MMI signals are correct as daily direction calls about 63% of the time. Please manage your trading risk accordingly.
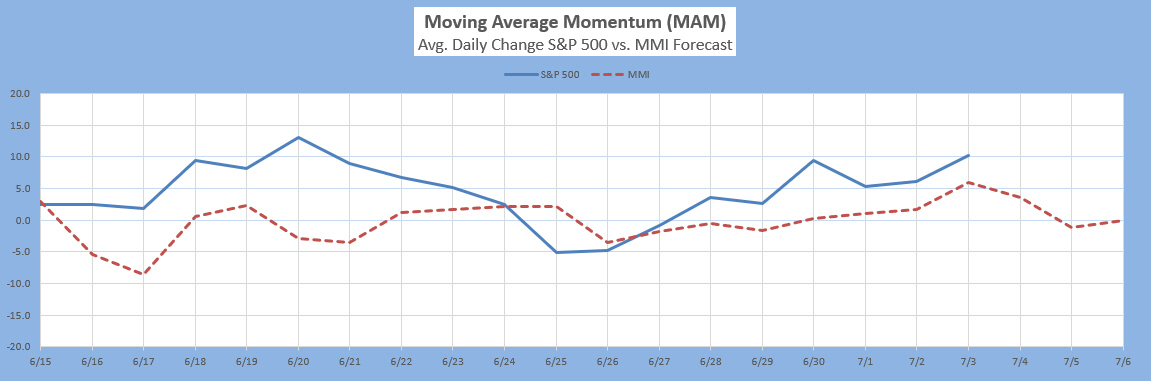
The Moving Average Momentum (MAM) Indicator's last major high signal was 11/1-9. The closing high on 11/7 fulfilled that. The last major low signal was 12/24-31. The market rallied strongly after the close on Dec. 24 which fulfilled the major low signal.
Intermediate Term Forecast:
The primary outlook is that a complex and corrective downward move is in progress. The weekly forecast implies a bearish slant through the third week of July. Monthly charts show a next low by sometime this month.
MM MACD signal is unconfirmed SELL and the intermediate trend is UP. There is no swing trade signal.
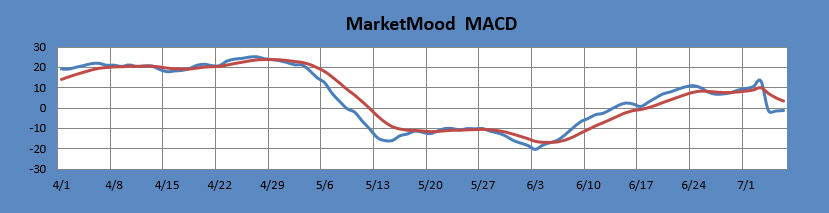
The MM MACD is similar to a standard MACD, except that it uses the MMI signal data to extend several days beyond today, while the standard MACD relies solely on historical market data.
Long Term Forecast:
The long term trend indicator (LTTI) continues in bullish trend / topping mode. The long term trend is indicated by the general divergence between the stock market and the mood generated forecast (see long term chart below). The MM Long Term Trend Indicator (bottom chart) which is derived from this divergence, indicates: "Bullish Trend, Hold long long-term positions." The MM LTTI has had this indication since 13 Feb 2019.
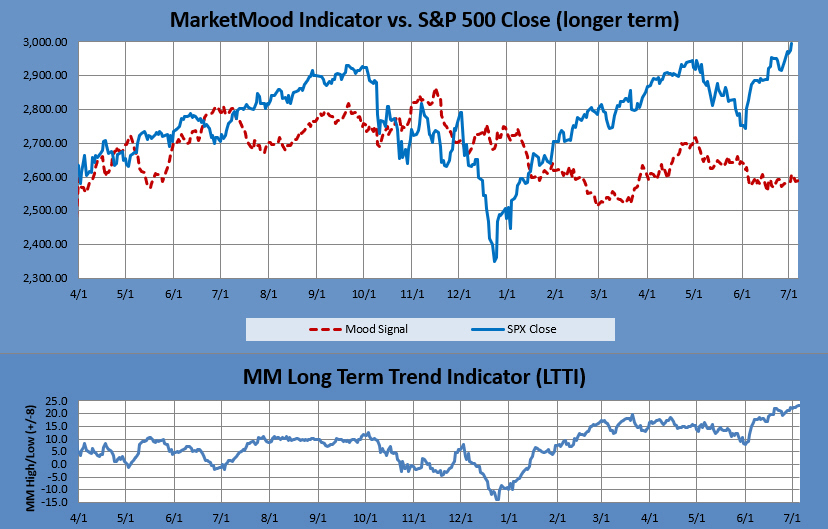
The MM LTTI measures trend strength using the divergence between the market trend and the forecast trend. A move above +8 or below -8 is bullish or bearish respectively. A value over 10 or under -10 followed by a move back through +/-8 signals a high or low is likely in. A subsequent move below +5 (or above-5) signals a trend change to bearish (or bullish).
