MarketMood Friday: Excited, then...
 By
By
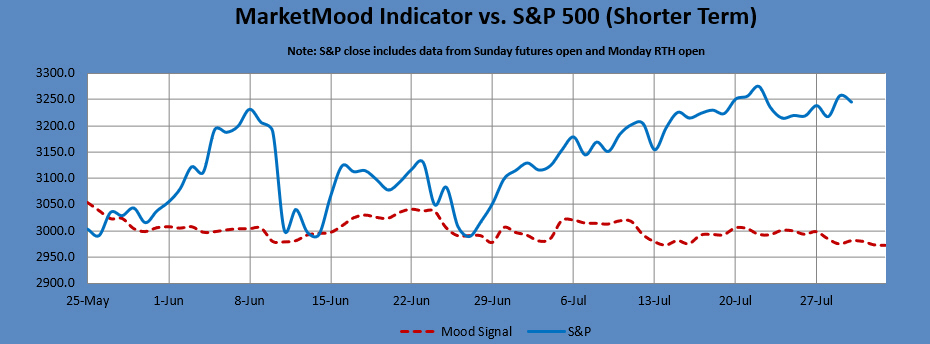
Where We've Been:
Caution lights were flashing last night and it looked like the drop would start "today or tomorrow." MMI was calculated up, but caution was advised and several reasons given for that. 1) The mood pattern points to volatility today (and elevated societal violence risk today through early tomorrow). 2) MMI2 was up for today, but changed to neutral. 3) The action in the metals market yesterday looked like the awaited for flip, calculated for tomorrow, already happened as that action looked like a big flip (note: that doesn't imply MMI is bearish metals now). For now, I'll still be watching for a flip from up to down for tomorrow (up first, ambiguity, then turning down), and hopefully the market will make it clear exactly which we are with that. The market closed down, but was on its way up and futures shot up quite a bit just after close.
Where We're Going
A long awaited flip completion is showing for Friday. The mood pattern before the flip is benign to giddy. After the flip, and through the weekend the theme is more crisis oriented. MMI is looking for a flip from up to down. Ideally, this is up first, ambiguous, then down.
The market has been diverging from where it would be more sustainably in line with sentiment. The daily and weekly trend indicators are now as overbought as they were in February just before things started heading south. Note: that by itself is not a sell signal, but it's worthy of note.
MMI Friday: flip up to down
MarketMood Data Info:
Internet search theme MMI inputs (mood vs effect reverting to normal): men, sports, serious, illness, disruption, government, giveaway, leader, death, grief, appreciation, body, freedom, medicine, hoax, president, internet, video, consequences
Next 3 Days:
| Date | Daily MMI | MMI 2* |
|---|---|---|
| 7/31 | flip up to down | - |
| 8/3 (open) | down | - |
| 8/3 | - |
*MMI 2 uses an alternate dynamic algorithm to convert the same sentiment source data to S&P direction as the original MMI algorithm.
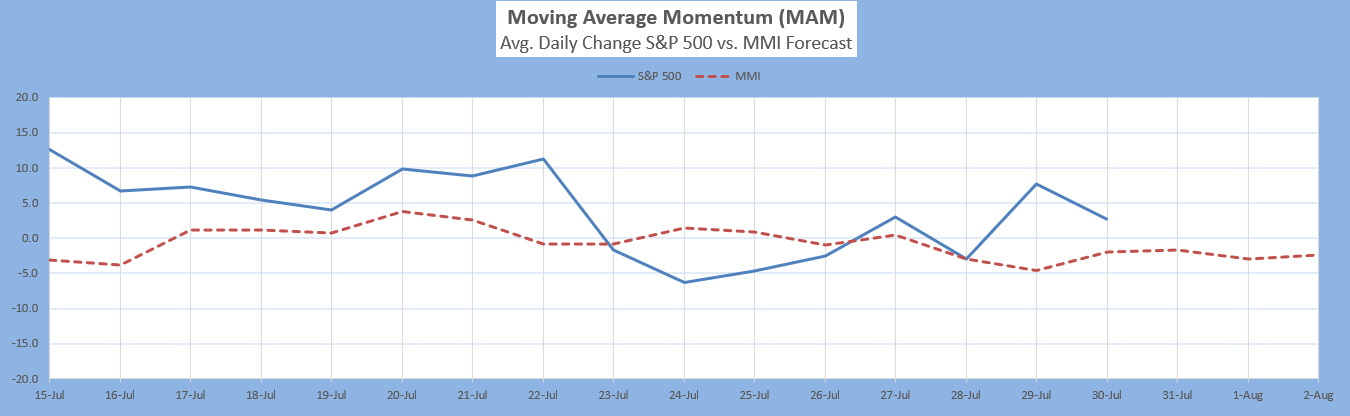
The Moving Average Momentum (MAM) Indicator's previous major low signal was 24-31 Dec., 2018. The market rallied strongly following the close on Dec. 24 which fulfilled the major low signal. The last major high signal was 8-27 Jan. 2020 (possibly the longest window ever). The closing high on 17 Jan. appeared to have fulfilled that, as the market dropped over 100 points following this window. Yet, the market quickly recovered its losses and made a new high. However, with that being the first major trend change signal in over a year, we needed to take seriously that it was pointing to something very different happening in both mood and market. The rest is history.
Current status: neutral
Intermediate Term Forecast:
The weekly price chart shows what is an extremely overbought market in need of correction, and is pointing down through mid-August. The weekly trend indicator shows an extremely strong bullish trend, but the weekly MM MACD has turned neutral from bullish. Monthly charts are pointing primarily down through August, and quarterly charts show a drop into end of year.
MM MACD signal is unconfirmed SELL and the intermediate trend is UP. There is no swing trade signal.
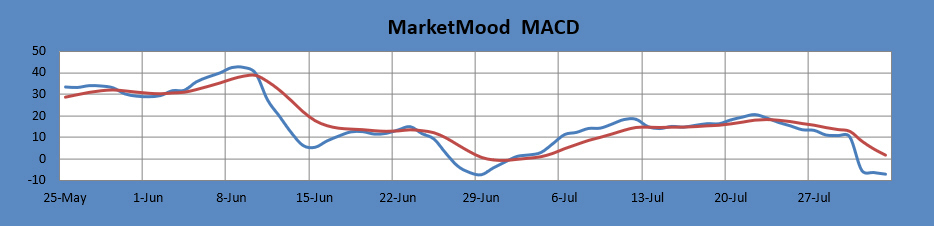
The MM MACD is similar to a standard MACD, except that it uses the MMI signal data to extend several days beyond today, while the standard MACD relies solely on historical market data.
The table below shows hypothetical trade results for strictly following the MM MACD signal vs. using the system suggested stop. Using the stop method may involve multiple trades per signal. Future results may vary.
| Date | Signal | @SPX | Signal P/L | System P/L | Net Gain Signal | Net Gain System |
| 03-Jan-20 | SELL | 3231 | ||||
| 08-Jan-20 | NEU | -48.48 | -28.73 | -48.48 | -28.73 | |
| 20-Jan-20 | SELL | 3317 | ||||
| 05-Feb-20 | NEU | -28.31 | 56.05 | -76.79 | 27.32 | |
| 12-Feb-20 | SELL | 3375 | ||||
| 27-Feb-20 | NEU | 391.74 | 212.69 | 314.95 | 389.25 | |
| 14-Apr-20 | SELL | 2778 | ||||
| 18-May-20 | NEU | -175.91 | -102.11 | 139.04 | 287.14 | |
| 27-May-20 | S/N | 2988 | -48.13 | -16 | 90.91 | 271.14 |
| 12-Jun-20 | SELL | 2998 | -116.14 | 155.00 | ||
| 24-Jun-20 | SELL | 3127 | 30.64 | 185.64 | ||
| 1-Jul-20 | NEU | -117.86 | -26.95 |
*indicates hypothetical trades for the current signal still in progress
Long Term Forecast:
The long term trend is indicated by the general divergence between the stock market and the mood generated forecast (see long term chart below). The MM Long Term Trend Indicator (bottom chart) which is derived from this divergence, indicates: "Bullish Trend, hold long-term bullish positions." The MM LTTI has had this indication since 29 Jun 2020. See further LTTI data below the chart.
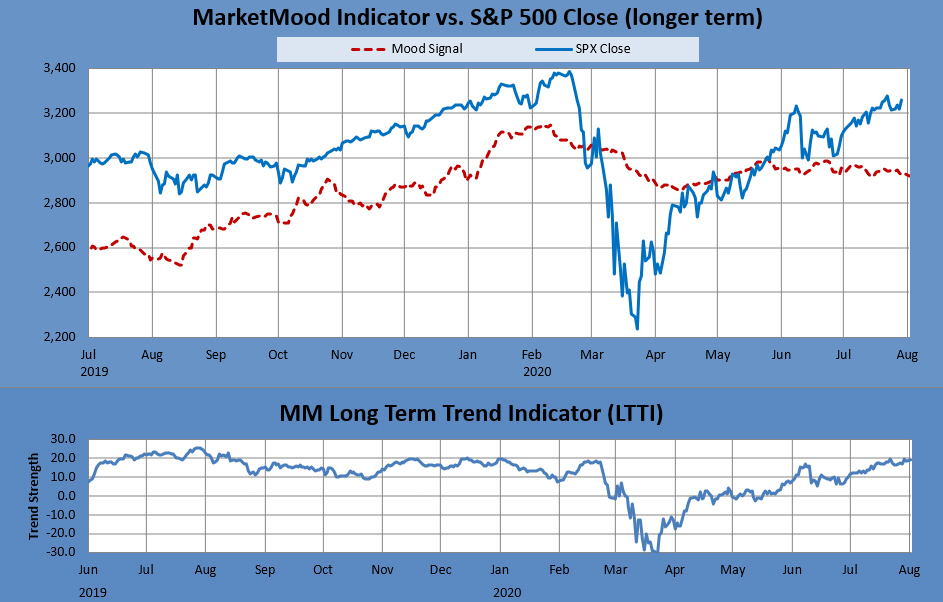
The MM LTTI measures trend strength using the divergence between the market trend and the forecast trend.
The table below provides data from the last few Long Term Trend Indicator's signals. It also compares a hypothetical trade using this indicator with the S&P 500's return during the same period. Future results may vary.
| Date | Days | Signal | SPX Close | Market pts | Points P/L | Net gain SPX | Net P/L |
| 8-Feb-19 | 1 | BUY | 2707.88 | ||||
| 10-Feb-19 | 2 | NEU | 2712.40 | 4.52 | 4.52 | 4.52 | 4.52 |
| 12-Feb-19 | 2 | BUY | 2744.73 | 33.35 | 36.85 | ||
| 31-Jan-20 | 353 | NEU | 3225.52 | 480.79 | 480.79 | 517.64 | 485.31 |
| 3-Feb-20 | 3 | BUY | 3248.92 | 23.4 | 541.04 | ||
| 25-Feb-20 | 22 | NEU | 3128.21 | -120.71 | -120.71 | 420.33 | 364.60 |
| 27-Feb-20 | 2 | SELL | 2978.76 | -149.45 | 270.88 | ||
| 2-Mar-20 | 4 | NEU | 3090.23 | 111.47 | -111.47 | 382.35 | 253.13 |
| 3-Mar-20 | 1 | SELL | 3003.37 | -86.86 | 295.49 | ||
| 4-Mar-20 | 1 | NEU | 3130.12 | 126.75 | -126.75 | 422.24 | 126.38 |
| 5-Mar-20 | 1 | SELL | 3023.94 | -106.18 | 316.06 | ||
| 10-Mar-20 | 5 | NEU | 2882.23 | -141.71 | 141.71 | 174.35 | 268.09 |
| 11-Mar-20 | 1 | SELL | 2741.38 | -140.85 | 33.50 | ||
| 6-Apr-20 | 26 | NEU | 2663.68 | -77.70 | 77.70 | -44.20 | 345.79 |
| 8-Apr-20 | 2 | BUY | 2749.98 | 86.3 | 42.10 | ||
| 21-Apr-20 | 13 | NEU | 2736.49 | -13.49 | -13.49 | 28.61 | 332.30 |
| 22-Apr-20 | 1 | BUY | 2799.31 | 62.82 | 91.43 | ||
| 11-Jun-20 | 50 | NEU | 3002.10 | 202.79 | 202.79 | 294.22 | 535.09 |
| 29-Jun-20 | 18 | BUY | 3053.24 | 51.14 | 345.36 |
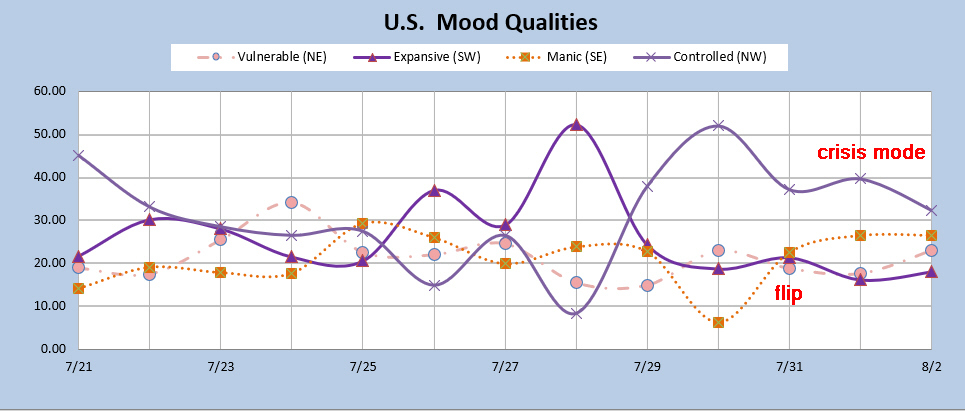
For the Extremely Curious:
Mood vs. effect is currently inverted so the bottom of the chart has been primary. The next flip will complete Friday as Vulnerable/Expansive begins to move nearly parallel. After that, the top of the chart becomes primary. After the flip, a "crisis mode" pattern is showing through the weekend.
Tomorrow's market mood and news themes: serious matters, responsibilities, jobs (after the flip)
Tomorrow's trader context is: serious matters, responsibilities
Recent Performance:
MMI's recent performance relative to a long term average of over 60% correct daily up or down calls indicates how closely it's been tracking with the market near term. In the basic daily performance stats below, posted signal flip days aren't counted in the total as there is no call on those days as to a positive or negative close. Monday open does count as a call unless it's part of a flip.
Note: MMI does least well in these conditions-- 1) EW 4th wave, 2) EW b wave, 3) Diagonals, and 4) Topping. More than one of these conditions concurrently present will further diminish performance.
This week: 2/5 (40%). Up calls 1/2 (50%). Down calls 1/3 (33%).
July so far: 5/14 (36%). Up calls 1/3 (33%). Down calls 4/11 (36%).
YTD: 41/83 (50%)
Conclusion: market tracking with sentiment on a day by day basis has been running way below average so far this year. Recently, it's been tracking below the average for the current year's performance. Daily up/down calls will likely not be reliable until the current market context of repeating diagonals and corrective structures has past.
Note: Changes to next day MMI signals occur about 5% of the time, and will be announced in updates as well as the daily report should they occur. Same day signals will not change. Day 2 and 3 signals reflect the most current information, and are subject to change. The default trade per the daily signals is executed at market on close. except on Mondays, as there is a signal for Monday open (i.e. "weekend close") and Monday close. The daily MMI signals are correct as daily direction calls about 63% of the time. Please manage your trading risk accordingly.
