MarketMood Friday: Beyond Reason
 By
By
Where We've Been:
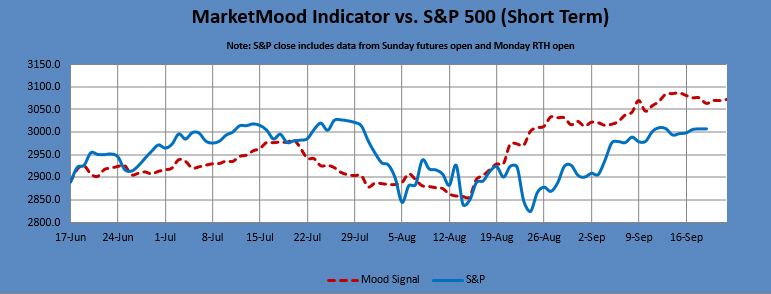
Today's mood pattern was ambiguous, but MMI gave the odds for a down close. After an upward meandering much of the day, the market changed its mind and closed unchanged.
Today's trader mood context was: "decision time"
Today's trader mood challenge was: "financial matters, issues close to home"
Where We're Going:
Tomorrow's mood pattern implies strong or passionate emotions alongside plain old irrationality (not a day for logic or reason). MMI gives the odds to the upside, but one has to be extra careful with these extra irrational days as they often don't make sense or behave according to plan. MMI is undefined once again for the weekend (Monday open).
MM MACD trade: There is still a swing sell signal at or below 2992 SPX. I'm not going to offer trade parameters on a new trade on this should it trigger again. Twice now, it has been a good scalp trade signal.
MMI Friday: close up
Tomorrow's trader mood context: "emotional, irrational"
Tomorrow's trader mood challenge: "uncertainty, surprises"
MarketMood Data Info:
Internet search theme MMI inputs: woman, model, star, injury, dance, tv, man, music, nostalgia, honor, sports, losers, winners
Short Term Forecast:
Next 3 Days:
| Date | Daily MMI | MMI 2* |
|---|---|---|
| 9/20 | close up | up |
| 9/23 (open) | ? | - |
| 9/23 |
*MMI 2 uses an alternate algorithm to convert the same sentiment source data to S&P direction.
Note: Changes to next day MMI signals occur about 5% of the time, and will be announced in updates as well as the daily report should they occur. Same day signals will not change. Day 2 and 3 signals reflect the most current information, and are subject to change. The default trade per the daily signals is executed at market on close. except on Mondays, as there is a signal for Monday open (i.e. "weekend close") and Monday close. The daily MMI signals are correct as daily direction calls about 63% of the time. Please manage your trading risk accordingly.
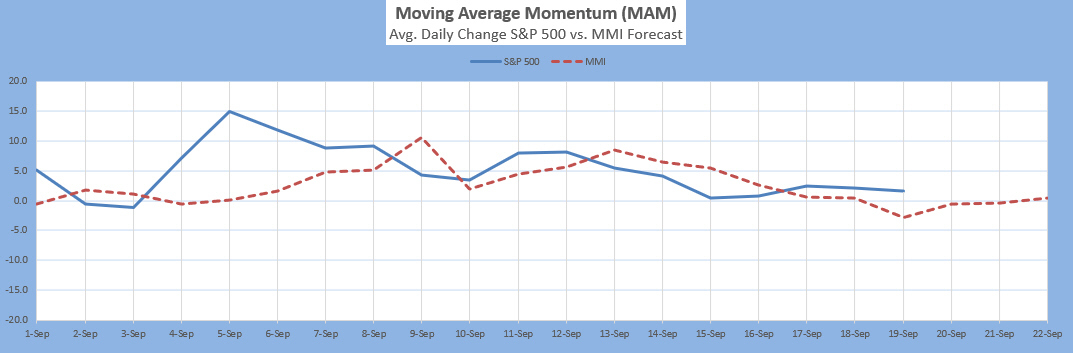
The Moving Average Momentum (MAM) Indicator's last major high signal was 11/1-9. The closing high on 11/7 fulfilled that. The last major low signal was 12/24-31. The market rallied strongly after the close on Dec. 24 which fulfilled the major low signal.
Intermediate Term Forecast:
The weekly forecast implies a market ready to drop for at least a week or two. Monthly charts show a market in need of a correction. They also show a big trend change around October.
MM MACD signal is confirmed SELL and the intermediate trend is DOWN. The swing trade signal is SELL at or below 2992 SPX.
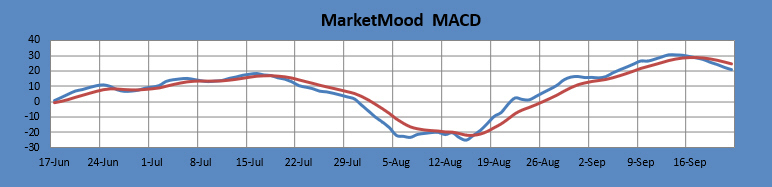
The MM MACD is similar to a standard MACD, except that it uses the MMI signal data to extend several days beyond today, while the standard MACD relies solely on historical market data.
Long Term Forecast:
The situation remains the same. The long term trend indicator (LTTI) continues in bullish trend / topping mode. The long term trend is indicated by the general divergence between the stock market and the mood generated forecast (see long term chart below). The MM Long Term Trend Indicator (bottom chart) which is derived from this divergence, indicates: "Bullish Trend, Hold long long-term positions." The MM LTTI has had this indication since 13 Feb 2019.
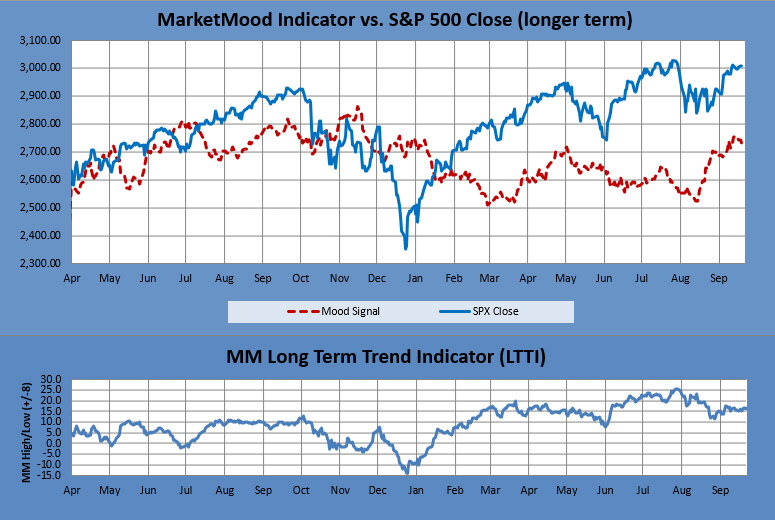
The MM LTTI measures trend strength using the divergence between the market trend and the forecast trend.
