MarketMood Friday: Attention Required
 By
By
Where We've Been:
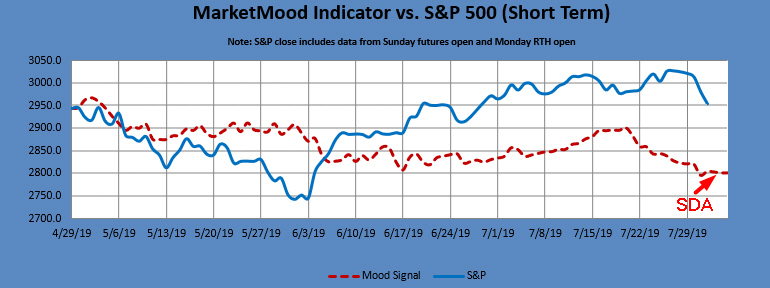
MMI was up for today and the market played along-- until it didn't. The mood pattern implied that people were more irrational (delusional) than usual and this morning's bounce was an illusion as well. I put out a post this morning stating that, and also that a Sharp Drop Alert was showing up on the chart. A short time and Trump tweet later we got a sharp drop.
Today's trader mood context was: "serious matters, responsibilities"
Today's trader mood challenge was: "financial issues, matters close to home"
Where We're Going
Tomorrow's MMI is down and the mood pattern points to a focus on government or geopolitical issues and a possible crisis moment. Both this mood and a Sharp Drop Alert were for Friday, yet a Trump tweet mini-crisis and SDA occurred today. I can't say for sure whether the market has used up some or all of Friday's bearishness or whether more downside and further crisis type news is in store for Friday. MMI2 is pointing up for tomorrow, cautioning whipsaw or intraday trend change(s). Overall, it's a day to pay close attention as the situation could change at a moment's notice. The weekend's MMI is "undefined" so there is no call for Monday open (MMI2 also has no call).
MMI Friday: close down (watch for whipsaw, surprises)
Tomorrow's trader mood context: "on alert"
Tomorrow's trader mood challenge: "financial issues, stability"
Sharp Drop Alert: There is a higher than normal risk for a sharp market drop through Monday open. This signal is generated when markets are overbought and the sentiment derived forecast is flat (see chart)
MarketMood Data Info:
Internet search theme MMI inputs: shooting, injury, death, police, food, celebration, hospital, woman, relationship, tv, competition, finale, info, internet, stealing
Short Term Forecast:
Next 3 Days:
| Date | Daily MMI | MMI 2* |
|---|---|---|
| 8/2 | close down | up |
| 8/5 (open) | ? | - |
| 8/5 |
*MMI 2 uses an alternate algorithm to convert the same sentiment source data to S&P direction.
Note: Changes to next day MMI signals occur about 5% of the time, and will be announced in updates as well as the daily report should they occur. Same day signals will not change. Day 2 and 3 signals reflect the most current information, and are subject to change. The default trade per the daily signals is executed at market on close. except on Mondays, as there is a signal for Monday open (i.e. "weekend close") and Monday close. The daily MMI signals are correct as daily direction calls about 63% of the time. Please manage your trading risk accordingly.
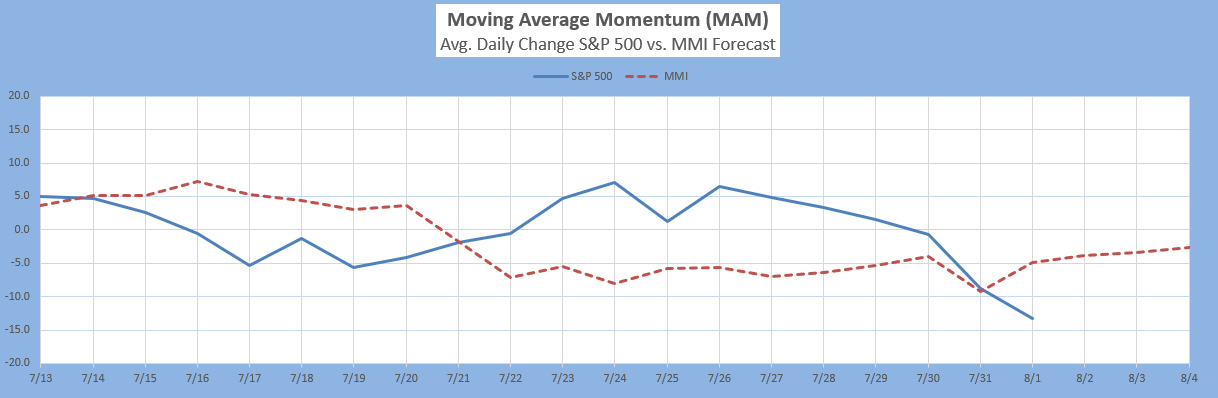
The Moving Average Momentum (MAM) Indicator's last major high signal was 11/1-9. The closing high on 11/7 fulfilled that. The last major low signal was 12/24-31. The market rallied strongly after the close on Dec. 24 which fulfilled the major low signal.
Intermediate Term Forecast:
The weekly forecast implies an extremely overbought market that could sharply correct at any time (which may currently be in progress). Monthly charts show a market in need of at least a quick sharp correction (which may be in progress). They also show a rally (or bounce) into a big trend change (down) around October.
MM MACD signal is unconfirmed SELL and the intermediate trend is UP. There is no swing trade signal.
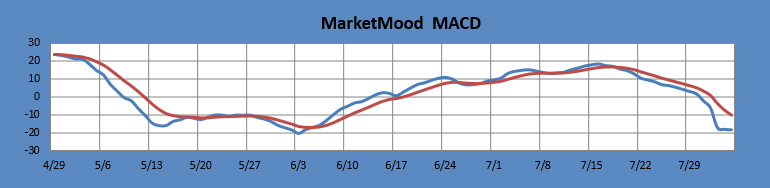
The MM MACD is similar to a standard MACD, except that it uses the MMI signal data to extend several days beyond today, while the standard MACD relies solely on historical market data.
Long Term Forecast:
The long term trend indicator (LTTI) continues in bullish trend / topping mode. The long term trend is indicated by the general divergence between the stock market and the mood generated forecast (see long term chart below). The MM Long Term Trend Indicator (bottom chart) which is derived from this divergence, indicates: "Bullish Trend, Hold long long-term positions." The MM LTTI has had this indication since 13 Feb 2019.
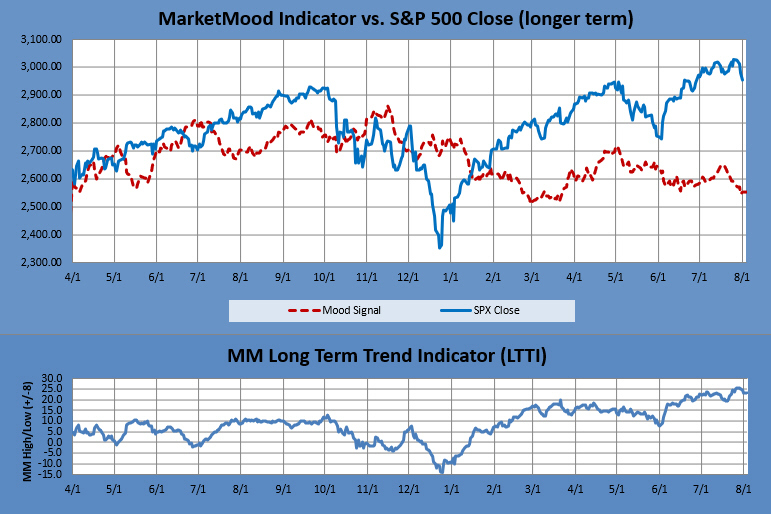
The MM LTTI measures trend strength using the divergence between the market trend and the forecast trend. A move above +8 or below -8 is bullish or bearish respectively. A value over 10 or under -10 followed by a move back through +/-8 signals a high or low is likely in. A subsequent move below +5 (or above-5) signals a trend change to bearish (or bullish).
