MarketMood Friday: At or Near a Top
 By
By
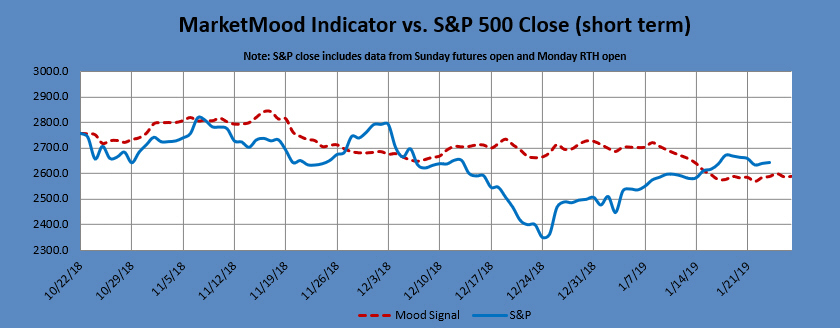
Where We've Been:
Tomorrow's MMI is up, but just barely. Tomorrow's mood pattern is complex. There is a slight bullish trend component, a volatility component which could point in either direction, and a government or global component which is more likely than not positive. Friday's mood pattern is completely irrational, and if the market closes up, Friday would likely be a local top. Regardless, be on the lookout for an important high or low on Friday due to the MM turn date.
MMI for Thursday was: close up; S&P 500 closed +0.14%
Where We're Heading:
MMI for Friday is up, but Friday's mood pattern is "hope in spite of the facts." This delusion/denial filled irrational pattern is usually near term bullish, and then followed by a negative "wake up call." Friday is a MM turn date which means we are looking for a significant high or low at or near Friday. This weekend's MMI (Monday open) is net down, and the mood pattern pointing to a "new chapter" of some type which has a serious tone to it and a government/global crisis component. A flip on Sunday does not change the overall MMI calculation for the weekend, but adds some uncertainty and could add some turbulence as Monday RTH approaches.
MMI for Friday: close up
MarketMood Data Info:
Internet search theme MMI inputs: holiday, nostalgia, prejudice, protest, hope, calendar, woman, president, potential
Short Term Forecast:
Next 3 Days:
| Date | Daily MMI |
|---|---|
| 1/25 | close up |
| 1/28 (open) | down |
| 1/28 |
Note: Changes to next day MMI signals occur about 5% of the time, and will be announced in updates as well as the daily report should they occur. Same day signals will not change. Day 2 and 3 signals reflect the most current information, and are subject to change. The default trade per the daily signals is executed at market on close. except on Mondays, as there is a signal for Monday open (i.e. "weekend close") and Monday close. The daily MMI signals are correct as daily direction calls about 63% of the time. Please manage your trading risk accordingly.
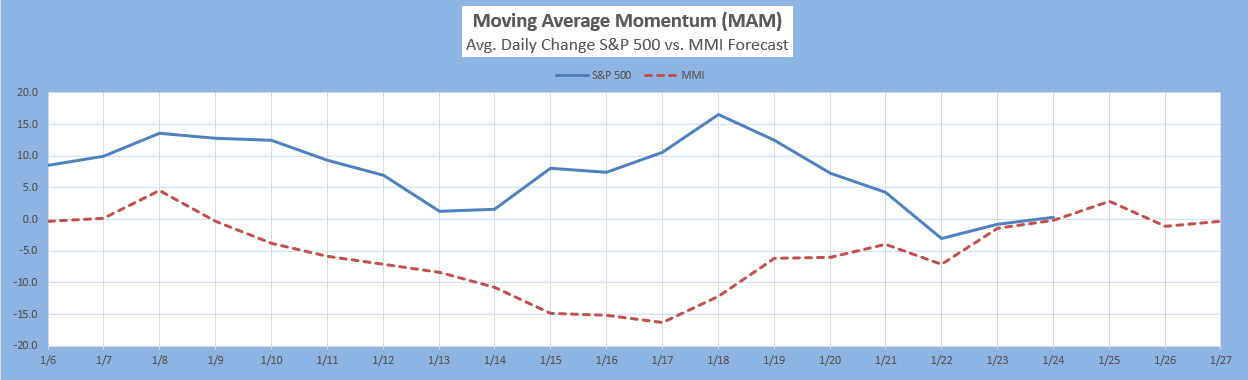
The Moving Average Momentum (MAM) Indicator's last major high signal was 11/1-9. The closing high on 11/7 fulfilled that. The last major low signal was 12/24-31. The market rallied strongly after the close on Dec. 24 which fulfilled the major low signal.
The MAM has issued a "significant trend change" signal from up to down during the window 1/18-1/25. A significant trend change means a noticeable trend change.
Intermediate Term Forecast:
The primary outlook is that a corrective move is in progress. Weekly charts are primarily down over the next few weeks. Monthly charts shows the market to be primarily in a corrective move through February then turning up sharply. A low is anticipated February/March.
MM MACD signal is unconfirmed SELL and the intermediate trend is UP. There is no swing trade signal.
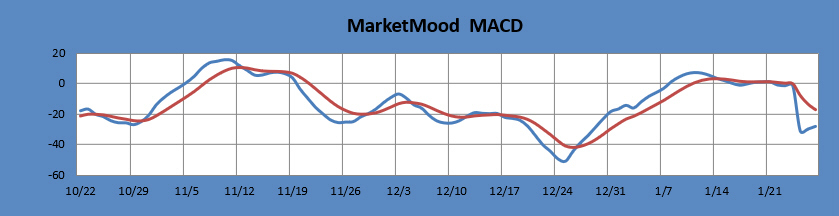
The MM MACD is similar to a standard MACD, except that it uses the MMI signal data to extend several days beyond today, while the standard MACD relies solely on historical market data.
Long Term Forecast:
The long term forecast continues in bullish territory. Since a two year bullish trend has recently concluded, the trend may now vacillate between bearish, neutral and bullish for a bit before firmly deciding on its long term trend. The long term trend is indicated by the general divergence between the stock market and the mood generated forecast (see long term chart below). The MM Long Term Trend Indicator (bottom chart) which is derived from this divergence, indicates: Bullish Trend, enter bullish long term positions. The MM LTTI has had this indication since 27 Dec., 2018.
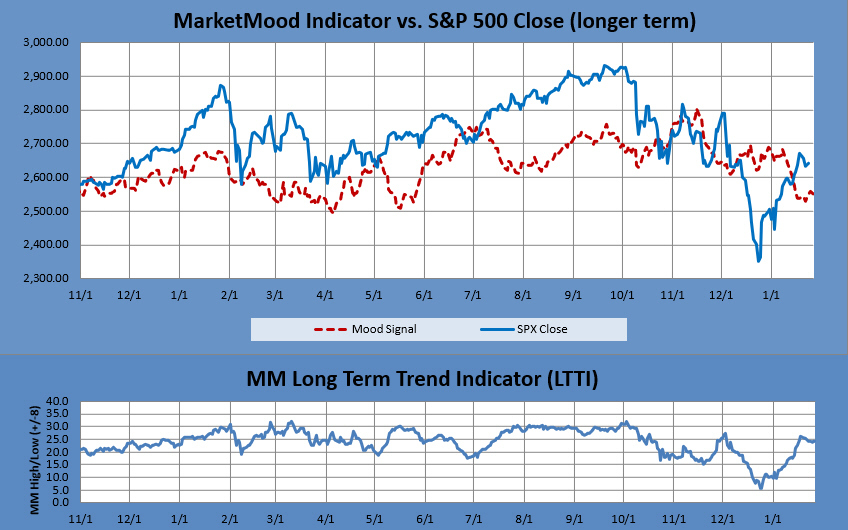
The MM LTTI measures trend strength using the divergence between the market trend and the forecast trend. A move above +8 or below -8 is bullish or bearish respectively. A value over 10 or under -10 followed by a move back through +/-8 signals a high or low is likely in. A subsequent move below +5 (or above-5) signals a trend change to bearish (or bullish).
