MarketMood Friday: And the Bad News is....
 By
By
Where We've Been:
Today's mood pattern was "denial" which is usually near term bullish followed by a reversal.
Where We're Heading:
Tomorrow's MMI is calculated as up, but the mood pattern points to "negative news" and being the day after a bullish denial pattern, I would be cautious on the upside.
There is a MAM major high signal for March 10-March 17. This results from both mood and market being sufficiently bullish that a major high is likely imminent and is estimated to be between now and March 17. Slightly less likely would be a major high between March 17-24 (one week after a one week window).
Internet search theme source data for MMI inputs (mood vs. effect inverted): women, calendar, honor, man, sports, business, contract
MM Indicators and Trading Parameters Summary:
| Indicator | Scope | Direction |
| LTTI | Longer Term Trend | Bullish |
| MMTT (main) | Medium Term Trend | Bullish > 3879 SPX |
| MMTT (HP) | Medium Term Trend | Neutral |
| MMTT (b/b) | Near Term bull/bear Trend Line | 3879 SPX |
| MM MACD | Swing Trade | Buy > 3842 |
Note: Medium term is roughly 1 week to 2 months. Longer term is roughly 1 month to 1 year.
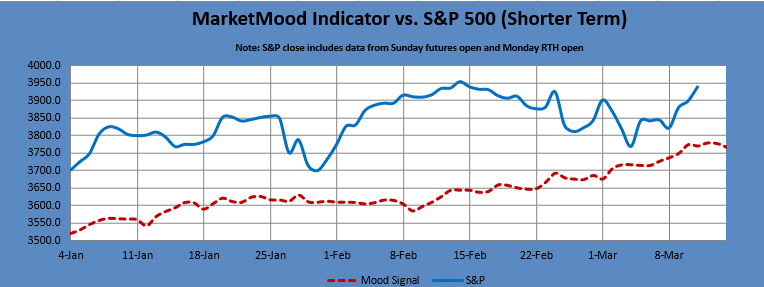
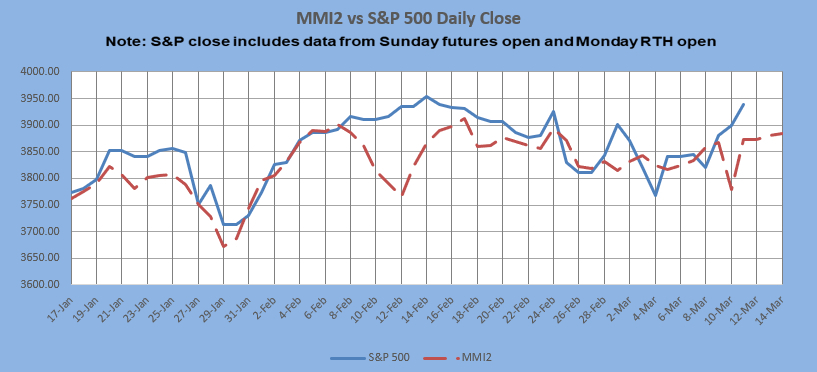
Shorter Term MarketMood Indicator vs. S&P 500 Charts:
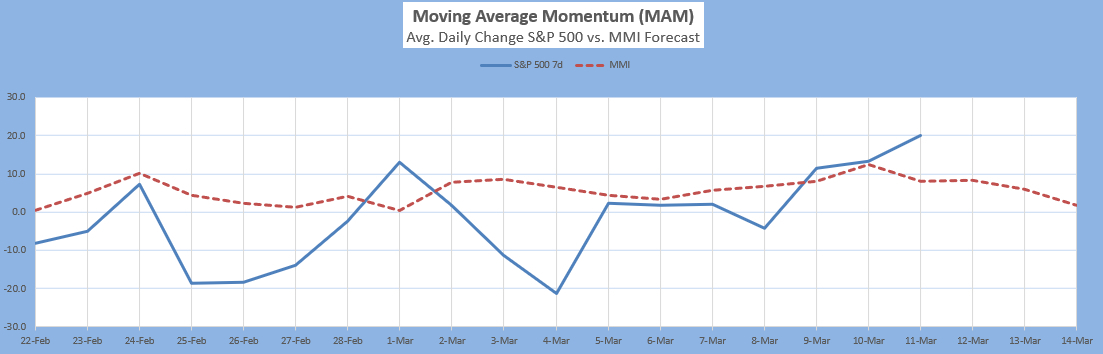
The Moving Average Momentum (MAM): It's been quite a long time since there was a normal major high or low signal. the indicator's last major low signal was 24-31 Dec., 2018. The market rallied strongly following the close on Dec. 24 which fulfilled the major low signal. There was an ambiguous low signal from 20-27 Mar. 2020. It was a combo major low and minor high in the same region. The market did make a substantial low in that time-frame. The last major high signal was 8-27 Jan. 2020 (possibly the longest window ever). The closing high in that window was 3330 on the 17th then again 3326 on the 23rd. The S&P 500 dropped about 100 points from there through end of month, which was the largest drop in some time. The market then rallied through February 19th to 3386, 60 points above the last high. That was the actual high point, about 3 weeks past this 3 week window. It most definitely was a major high point as it was followed by a steep drop of almost 1000 points before a closing low on March 23, 2020.
There is a new MAM major high signal for March 10-March 17. This results from both mood and market being sufficiently bullish that a major high is likely imminent and is estimated to be between now and March 17. Slightly less likely would be a major high between March 17-24 (one week after a one week window).
Current status: highly overbought
Intermediate Term Forecast:
There are two primary scenarios for April-May depending on how March finishes up. The base case is for the current decline to bottom and then for a continuation up to a high in March. The alt case would be for a failed rally down to a low in March.
MM MACD signal is BUY and the intermediate trend is bullish > 3842. The swing trade signal is BUY > 3842 SPX (cash).
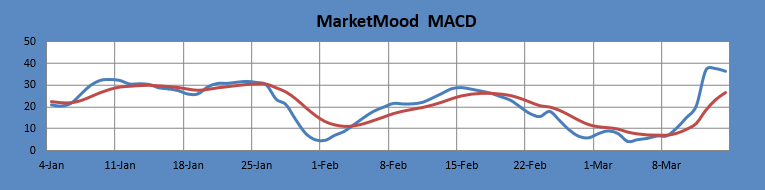
The MM MACD is similar to a standard MACD, except that it uses the MMI signal data to extend several days beyond today, while the standard MACD relies solely on historical market data.
Long Term Forecast:
The long term trend is indicated by the general divergence between the stock market and the mood generated forecast (see long term chart below). The MM Long Term Trend Indicator (bottom chart) which is derived from this divergence, indicates: "Bullish Trend, hold long long-term positions." The MM LTTI has had this indication since 4 Nov 2020.
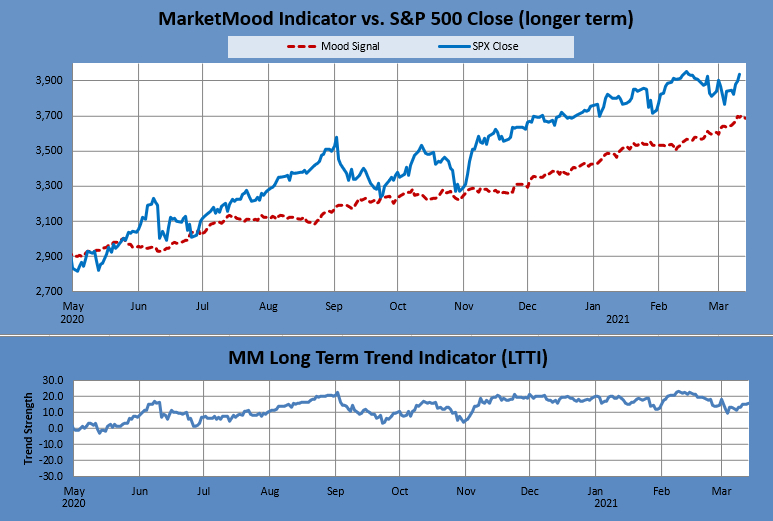
The MM LTTI measures trend strength using the divergence between the market trend and the forecast trend.
