Market Rangebound For The Moment
 By
Ricky Wen
By
Ricky Wen
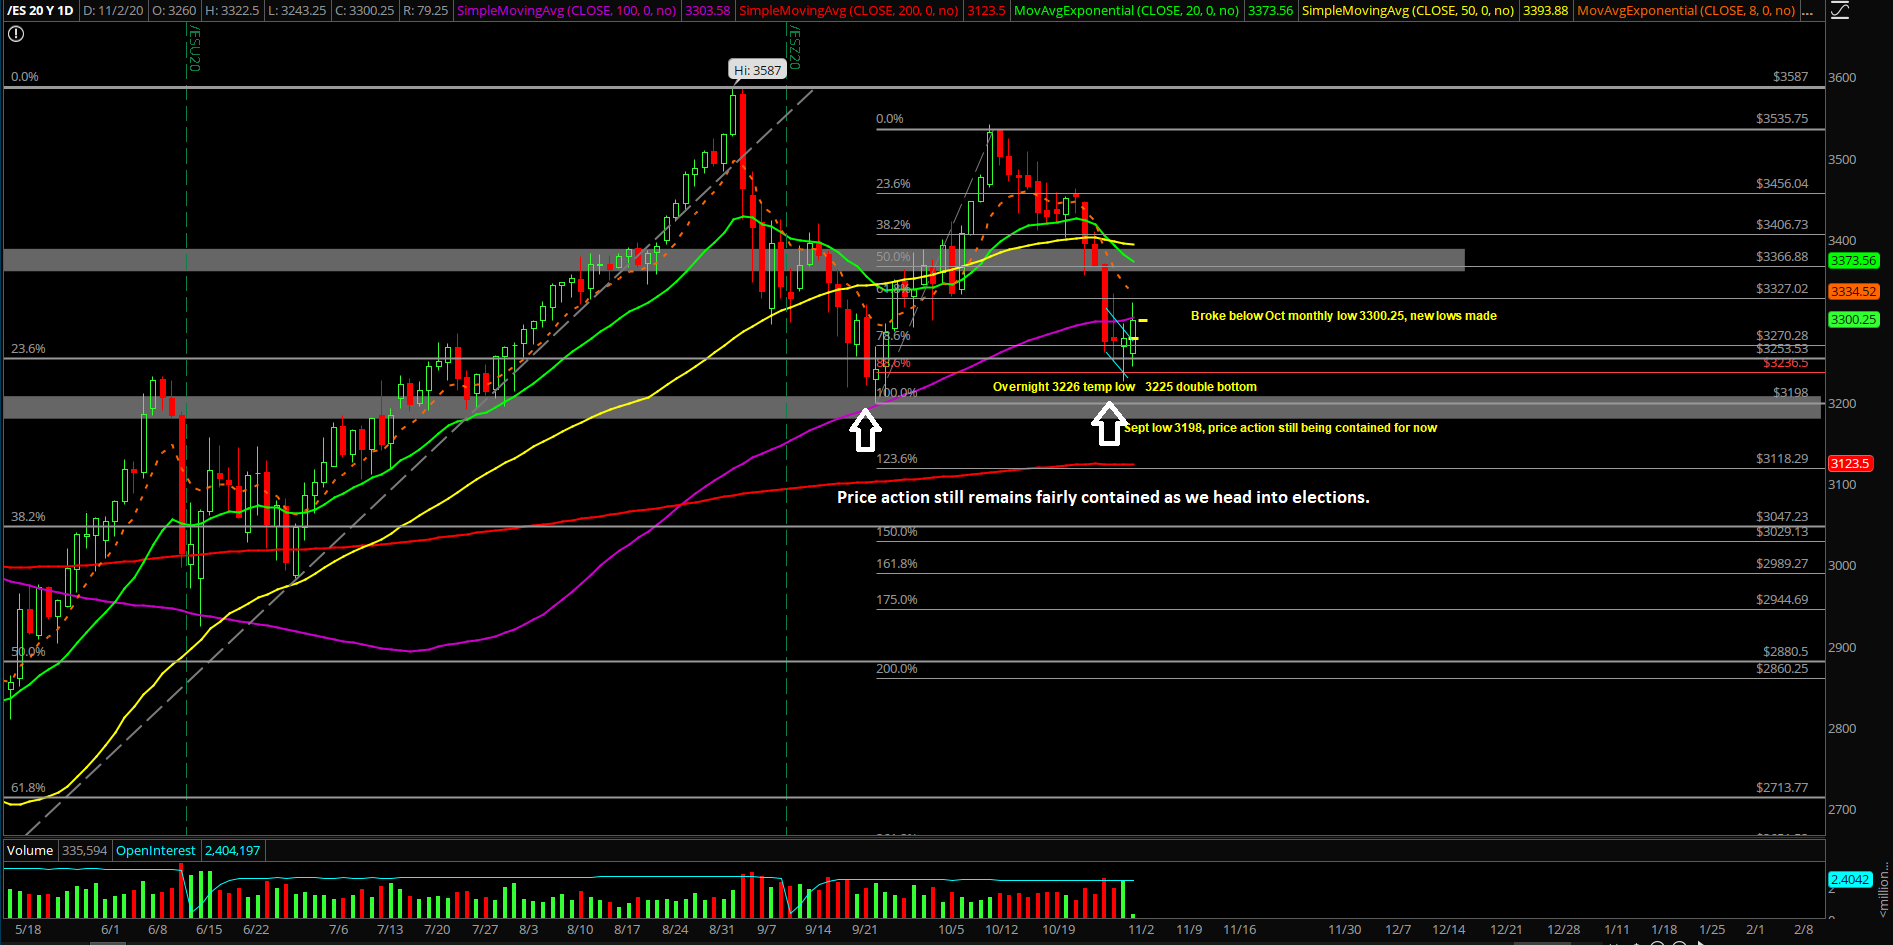
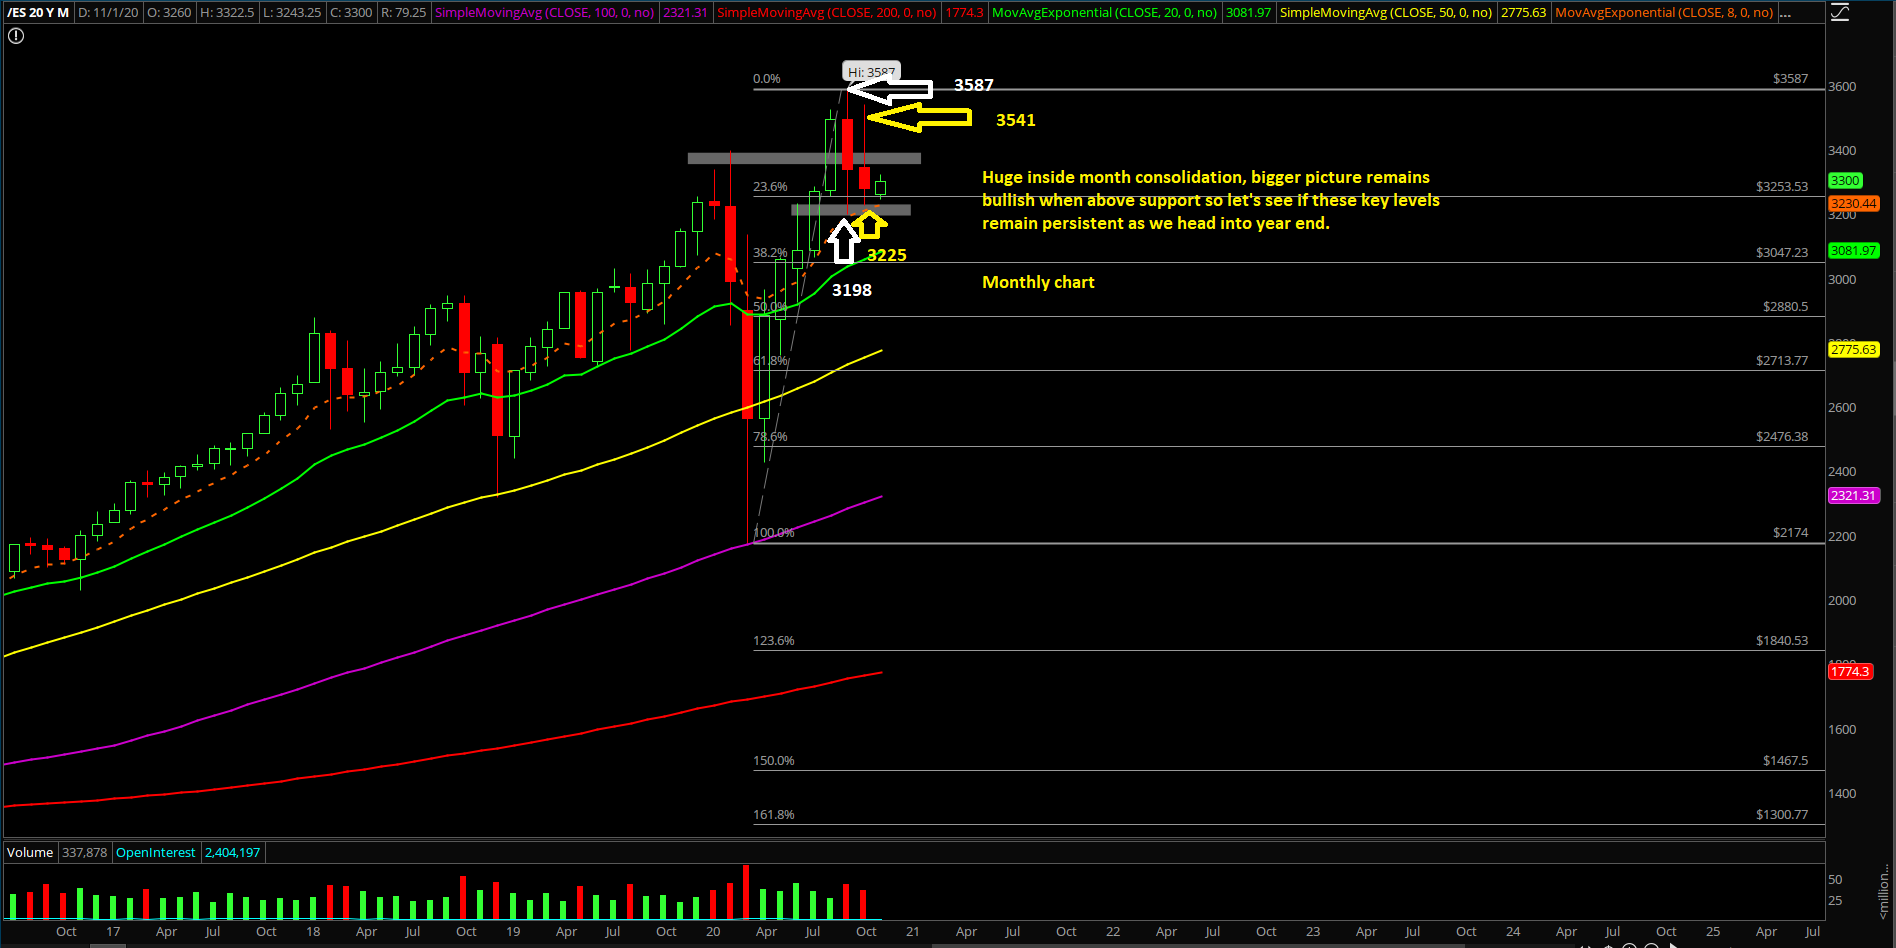
The final week of October played out as a trend week down into backtesting some key support levels fulfilling a few of our continuation targets. However, bears were not strong enough to expand the range any further yet. The entire drop so far has been well contained given the established Sept lows of 3198 in the Emini S&P 500 (ES), so it’s crucial for both sides to keep fighting as we head into elections and then year end.
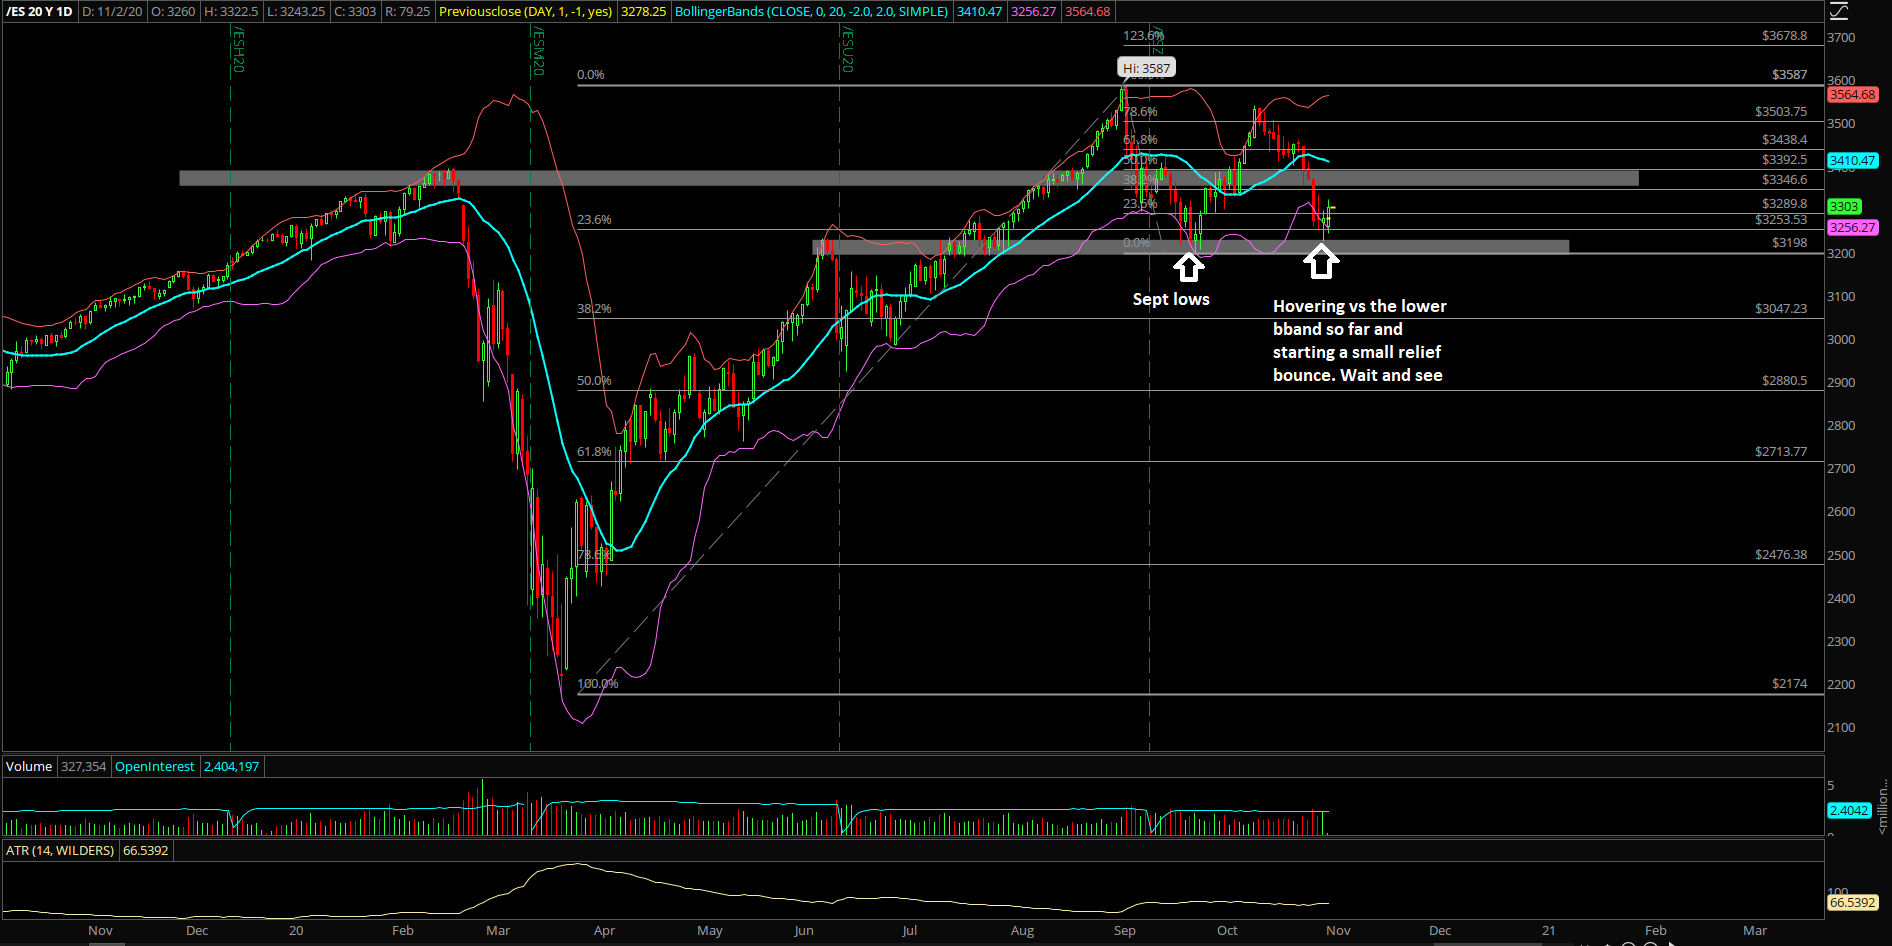
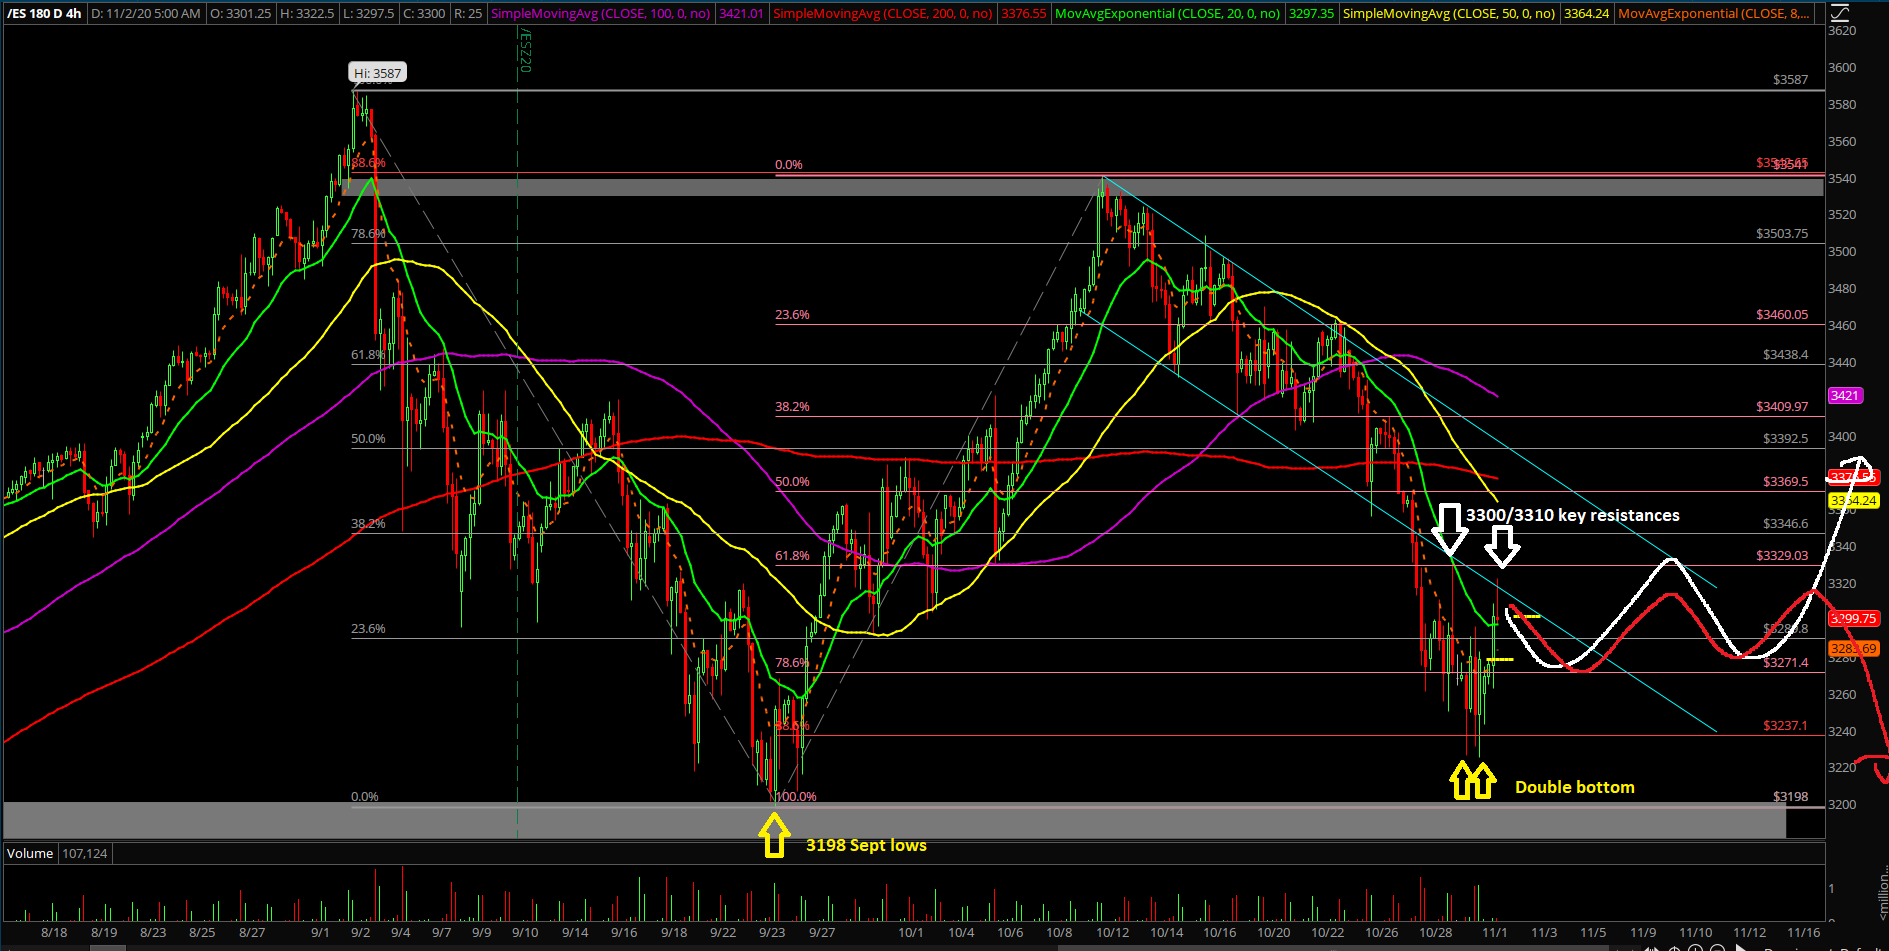
The main takeaway remains the same: The daily 20EMA has been broken for the second time in many months (the first time was during September for 14 sessions, then it made a V-shape recovery). Friday was day 5 of the setup, with the bears trying to fulfill the 3198 target, but price action made a temp low of 3226 followed by a double bottom at 3225 during Friday’s RTH.
This is where the complications start because the easiest portion of the ride is now considered done from the 3400 breakdown to the present time. We would need to wait for the elections timing catalyst to expand this range further. For now, rangebound will likely occur given the digestion/consolidation structure from Friday and Sunday night.
What’s next?
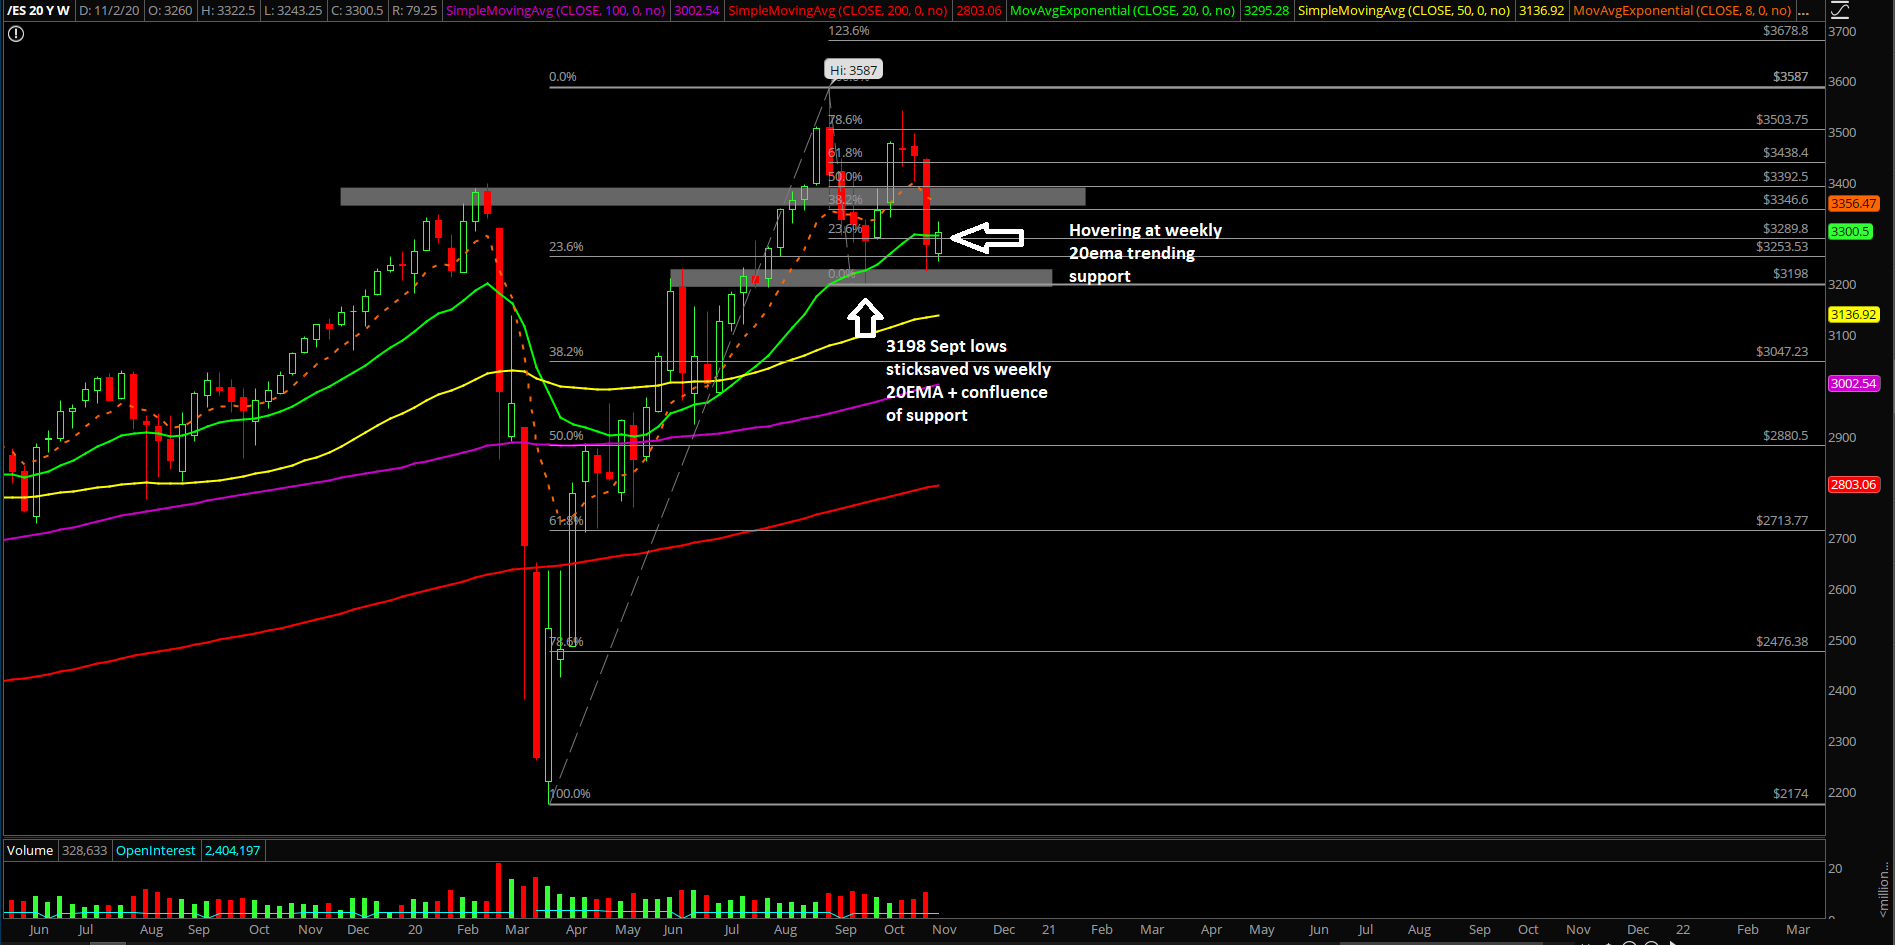
Friday closed at 3278.25 on the ES as a hammer formation indicating the start of a relief bounce if support continues to hold. And Sunday has provided the market with the current higher lows formation. In addition, price is now back to hovering around weekly 20EMA and working off of the daily 2std lower BBand, so keep watching this as price expands/digests.
In sum:
- Bears couldn’t wrap up the October closing print at the dead lows so as the bulls fought back with a quick +1.5% recovery from 3225 to 3270s during the final power hour of Friday.
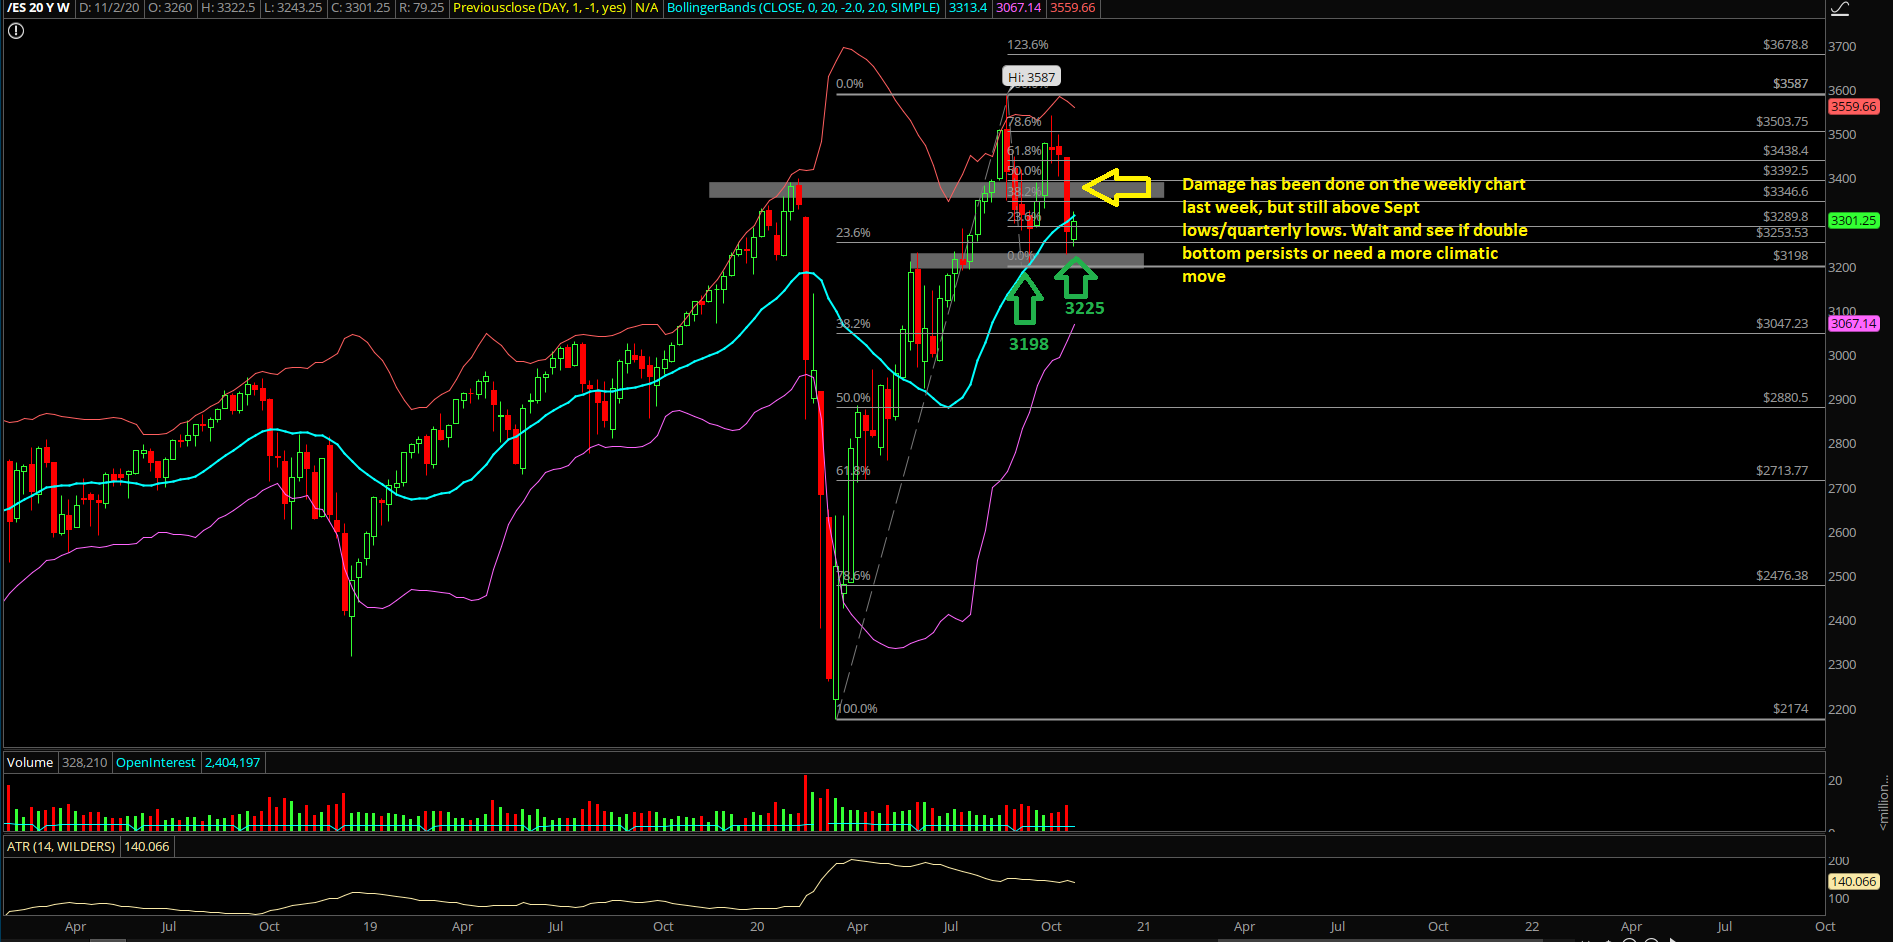
- Either way, the damage has been done on the higher timeframes because October was a massive inside bar range of 3541-3225 that was fully within September’s range of 3587-3198.
- This means that going forward: these key levels on the downside/upside need to be broken decisively in order to expand the range any further. We have elections coming up so it would be the perfect excuse for the market to complete that feat.
- Just note that the bigger picture is still quite bullish as we head into year end/2021 so the short-term bears are on a timer here. Understand and know the timeframes at stake here.
- If you recall the 3198 Sept low remains the quarterly low and bears must break below that pivot to really threaten or lower the probabilities of our expected year-end highs closing print.
- Zooming into the short-term, treat Sunday low of 3240s as today’s low with the context of a higher lows pattern vs last week’s low of 3225. This means that we’re watching for subsequent higher low and higher high formations given this current relief bounce
- For immediate resistances, we’re still using the same key levels at 3310, 3330 from last week as these key levels have acted very well for the bears.
- 3240s-3330 current range boundaries so just trade both sides with a rangebound strategy until price action proves otherwise for today. We’re bull bias for this morning/today when above 3258 on the short-term.
- Bigger picture wise, the must hold resistance on a daily closing print resides at 3385. Know and understand the different timeframes at hand here as immediate intraday momentum vs daily may be confusing to some market participants.
- A break above 3385 would be large enough to classify as a massive bull engulf or bull reversal candlestick on the daily chart if price action begins a V-shape recovery similar to Sept lows (need sustained closes above 3385 for follow-up).
- In addition, for traders/investors that have longer timeframes, please note that the market closed below the daily lower BBand for most of last week. Keep an eye on expansion vs digestion.
- Separate your trading accounts vs investing accounts’ game plan as wildcard elections coming into play alongside with the higher volatility. Make sure you compartmentalize the different timeframes, strategies and risk exposure.