Market Outlook: A Deeper Dive Into Inflation
 By
Rida Morwa
By
Rida Morwa
Summary
The market continues to trend sideways.
Inflation remains the focus of financial news.
A deeper look into last week's inflation metrics.
Good Morning HDI!
The market continues to consolidate and taking a breather from the rally occurring since October of last year. Opinions are plentiful, with the bulls saying that the rally will continue while the bears expect another breakdown.
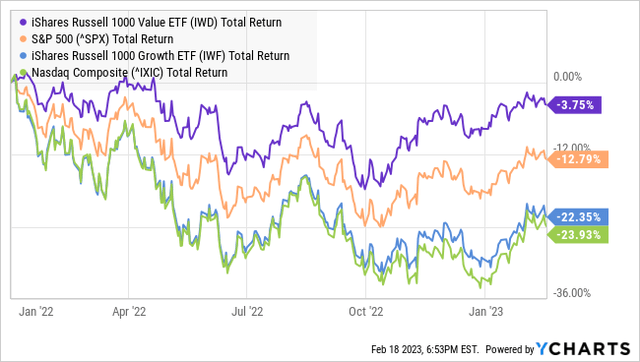
Simply put, the market is in a period of great uncertainty. Nobody knows which direction the market will break.
The news cycle has naturally gone back to focusing on inflation and the Federal Reserve. I consider it a sign of underlying bullishness that the markets held up in the face of inflation headlines, breathlessly announcing that inflation is "sticky" and "higher than expected."
As I've noted before, results in relation to "expectations" tell you much more about the people making the predictions than the results themselves. It is ironic that the "experts" are proven wrong in their prediction, and then those same experts come out and make a new prediction and expect us to believe them.
Remember, these same "experts" decrying how sticky inflation is today are the same group of folks who were all assuring us that inflation was "transitory" two years ago.
Forget the headlines. Today, we are going to take a look at what the inflation reports are really telling us. This requires looking a bit deeper than the headline number and understanding what the driving forces are.
Producer Price Index
The Producer Price Index, or PPI, measures inflation at the business level. This can be a useful indicator of the risk of future consumer inflation. The reason is that businesses that are faced with higher costs will tend to pass along at least some of that cost to consumers in the future. Businesses experiencing lower costs are likely to attempt to compete by lowering prices.
In the January Producer Price Indexes report, PPI was up the highest, month-over-month since June. PPI is typically broken into two groups: Goods and Services. As we can see, it was inflation in goods that caused the spike up. Source
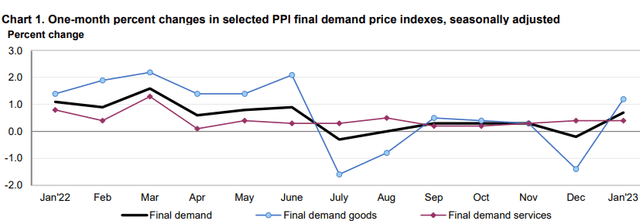
BLS January PPI
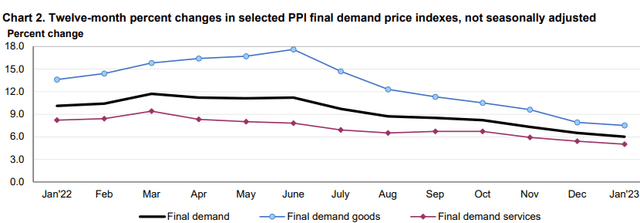
Reading news reports, you might be convinced that inflation has "returned." January was in the ballpark of April or May 2022. But remember, this is a monthly measurement. When we look at the annual numbers, PPI slowed down. While the pace of the decline slowed for a month, PPI has been on an overall downward trend since March 2022, with goods inflation not slowing until June 2022.
BLS January PPI
When we look at the history of the PPI, we can see that it has hardly been smooth month to month. In fact, it looks a lot like an EKG:
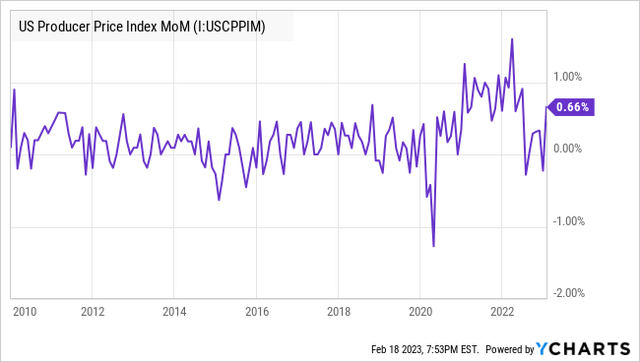
Were people freaking out over "sticky" inflation when PPI shot up to similar levels in October 2018, September 2012, February 2011, or January 2010? Of course not. Especially on the heels of extremely low PPI inflation as the six months from July through December, PPI was only 0.4%, 0.8% annualized – which, excluding the COVID crash, was the lowest six months of PPI inflation since 2016.
So the headline number spiking up on its own has not historically indicated that inflation is going up over longer periods. It is quite normal behavior from the PPI number. We can also expect PPI to be slightly higher than consumer inflation measures like CPI (Consumer Price Index). But let's dig a little bit deeper to understand why PPI spiked up.
Exactly Which Prices Went Up
We can see on the surface that the big swing was in Goods, as Services inflation remained flat. Where did inflation come from? According to the PPI report:
"Most of the January advance is attributable to a 5.0-percent jump in prices for final demand energy. The index for final demand goods less foods and energy increased 0.6 percent. In contrast, prices for final demand foods fell 1.0 percent."
It goes on to note that one-third of the January rise was tied to gasoline prices, with residential natural gas, diesel, and jet fuel all being major contributors. On the "intermediate demand" level, diesel alone contributed to half the total increase.
We have to remember the BLS (Bureau of Labor Statistics) is always looking backward. It is measuring inflation from January 1st to January 31st. Not a day later. What happened a day later?
Gasoline prices did spike up in January, especially compared to the dip in December, but are down in February and don't hold a candle to where they were in mid-2022:
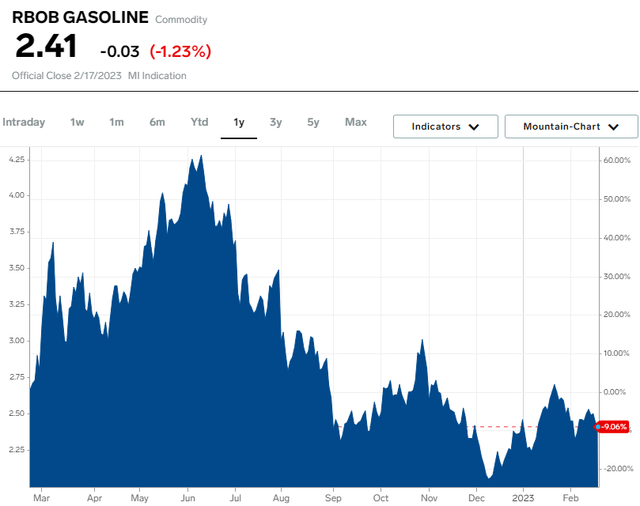
Business Insider
Diesel similarly spiked up in January but fell off a cliff quickly in February. Again, not even in the ballpark of where it was in early to mid-2022.
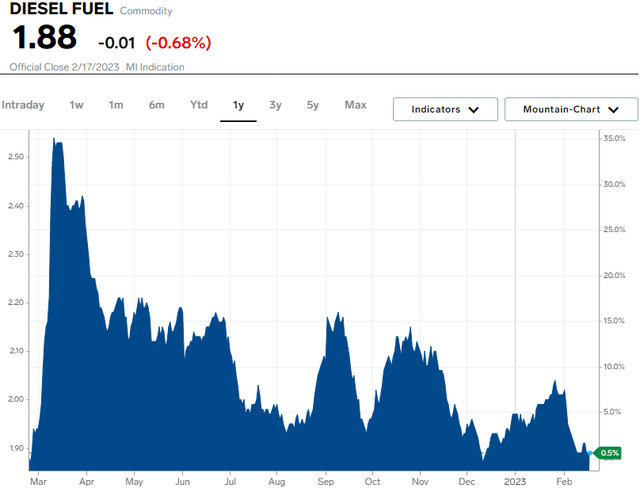
Business Insider
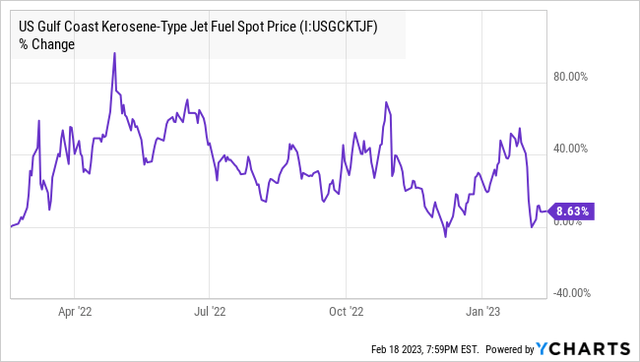
Jet fuel also spiked up in January, and the rally in prices was also short-lived.
Perhaps the starkest example is "residential natural gas" prices, which were higher in January. Yet at the commodity level, natural gas has crashed 75% from 2022 peaks.
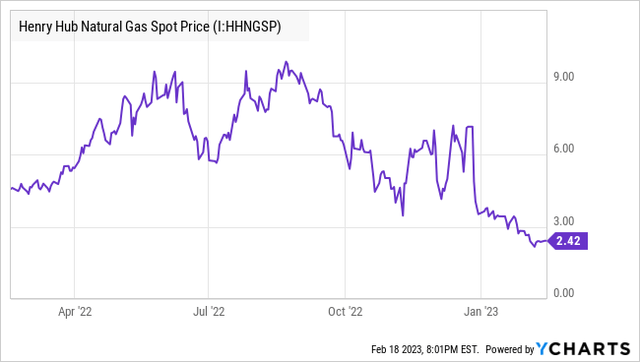
It is only a matter of time before this decline works its way through the industry and leads to lower residential gas prices.
So yes, prices did spike up in January across these commodities and caused a spike in PPI. Yet we can also see that since January, the prices of all these things have come right back down. This isn't the long-term sustained price increases we saw in late 2021 and early 2022. It was a price surge that quickly turned around.
PPI is a lot more volatile than other inflation measures – largely because businesses are impacted more directly and immediately by changes in commodity prices. Commodities have always been volatile markets. The inflation of 2021/2022 was not caused by a spike up in commodity prices; it was caused by an environment of sustained high prices. We don't see that coming back in January's data. We see price spikes that lasted a few weeks and are now deflationary.
CPI
Let's do the same analysis of the other major inflation report that came out last week. CPI was up 0.5%. A significant spike after 0.1% in December, but still lower than last year. Source
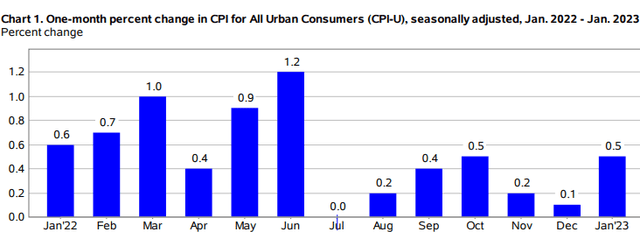
BLS January 2023 CPI
Similar to the PPI, when you look year-over-year, we can see a steady decline.
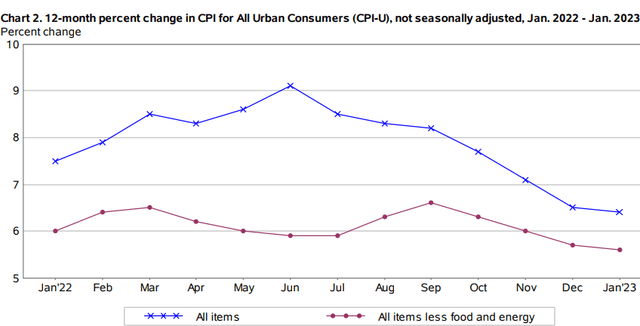
BLS January 2023 CPI
Let's refresh our memory about what these two charts looked like for January 2022 CPI - you know, the good ol' days when inflation was "transitory." Source
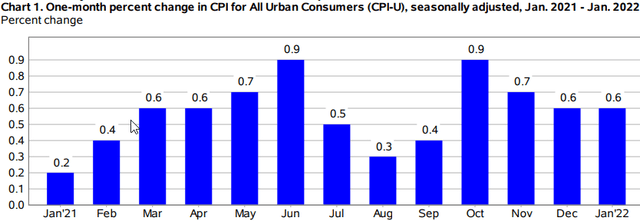
BLS January 2022 CPI
See a difference? And here is what the year-over-year chart looked like.
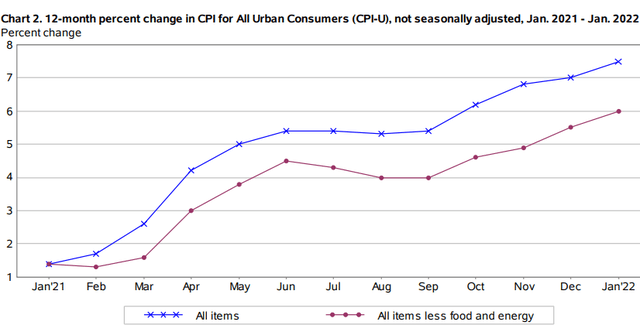
BLS January 2022 CPI
That is what out-of-control sticky inflation looks like.
Exactly Which Prices Went Up
Whenever we look at inflation numbers, we need to remember that they are backward-looking. Like PPI, energy was a major contributor to the headline number, with the energy index up 2%, led by residential natural gas, gasoline, and electricity. As discussed above, the prices of these things are already moderating. It takes time for lower commodity prices to filter into consumer prices. The Fed can't speed up or slow down that process.
So let's turn to "core" CPI, which excludes the volatile food and energy sectors. Core CPI was up 0.4% month-to-month. The largest contributor? The shelter index rose 0.7%. Shelter is significant for CPI because it has the largest weighting, accounting for more than 34% of CPI and over 40% of core CPI. From the CPI report:
"The index for all items less food and energy rose 5.6 percent over the past 12 months. The shelter index increased 7.9 percent over the last year, accounting for nearly 60 percent of the total increase in all items less food and energy." [author's emphasis]
So core CPI increased 5.6% year-over-year, and shelter accounted for 60% of that increase. 60% of 5.6% equals 3.36%. Everything else accounted for an increase of 2.24%. The Fed's inflation target is 2%.
Is rent really going up? Not anymore. We pointed out in 2021 that CPI was woefully underestimating rent. We also pointed to this report by the Dallas Fed discussing the delayed impact of housing prices on OER (Owners' Equivalent Rent).
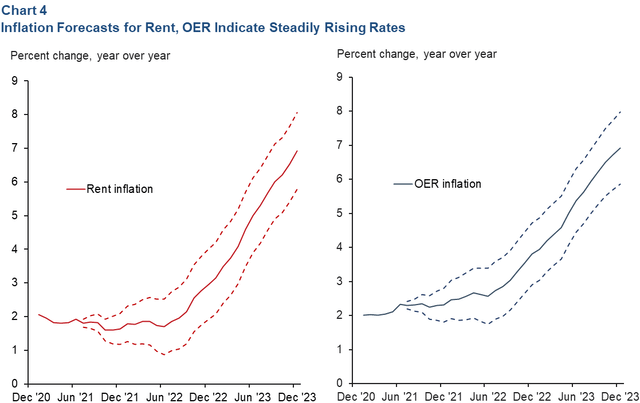
Note that in August of 2021, the Dallas Fed was projecting OER inflation to be around 7%, based on prices that had already gone up. The Dallas Fed projected it would take about 18 months for the inflation that had already occurred to be reflected in the data.
The actual result came at the high side of the Dallas Fed's estimates at 8.6% for rent inflation and 7.8% for OER inflation, yet their projections were very close.
We have to remember the BLS is relying on old data, especially when it comes to rent and housing. That's why it reported shelter inflation of only 2% in the midst of the boom in housing and rent prices. Now it is the opposite.
The median home price is up only 1% year-over-year. Asking rents are only about 2.4% higher than they were in January 2022 and have been declining monthly. Source
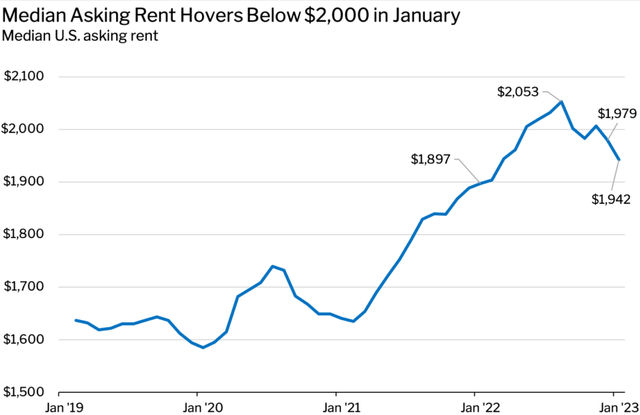
Redfin
There was significant rent inflation, but clearly, it occurred from January 2021 to about July 2022. During that period, rents increased about 24%, and the BLS picked up only a fraction of that increase. Now that rents are actually declining, rent is being reported as the single largest contributor to inflation metrics.
It's a day late and a dollar short.
Conclusion
There seems to be the idea that inflation should just suddenly stop overnight, and since it didn't, we should panic. That just isn't how economies work. Economies have momentum. There is no interest rate hike that could have magically stopped inflation in its tracks. The Fed allowed it to surge untouched for two years. They could have hiked to 10% overnight, and inflation would have persisted. This is why it became standard practice for the past 40 years for the Fed to "nip it in the bud" at the first signs of hot inflation. It will take time for inflation to come back down to 2%.
Moreover, we want it to take time. I once went rock climbing, but I was facing a fear because heights aren't my thing. I made it to the top, and boy, was I ready to come down! I wanted little more than to have solid ground back under my feet. Yet no matter how much I wanted to be down right now, I didn't want to fall!
Inflation is the same way. It is high, and we all want it to be lower. Yet the path that would cause inflation to be down tomorrow would be a horrible recession. A collapse of the economy would bring inflation down quickly. That isn't what we really want.
I don't know how the Fed will interpret these reports. The next Fed meeting isn't until March 22nd, so there is plenty of time for more economic reports between now and then.
Does it matter? In the big picture, it does not. The futures market is pricing in a 96% probability that the Fed's target rate will peak between 5% and 5.75% by July. That suggests two to four 25 bps hikes. Last year, the Fed could accomplish that in one meeting.
The worst of the hiking cycle is behind us. The worst of inflation is also behind us. The great question now is how fast will the way down be.
We want to continue to be opportunistic. When prices decline in one area or another, we can use that as an opportunity to buy income at a lower price. The market is trending sideways, and there is not a clear catalyst that is likely to change that.
In times like these, identify which areas you want more exposure to and buy shares opportunistically as small sell-offs occur. Inflation will come down, and the Fed will do what it does. We can't do anything to control those factors. What we can do is focus on buying more future income!
Happy dividend collecting!
