Major Point Of Contention At ES 4400-4410 Zone
 By
Ricky Wen
By
Ricky Wen
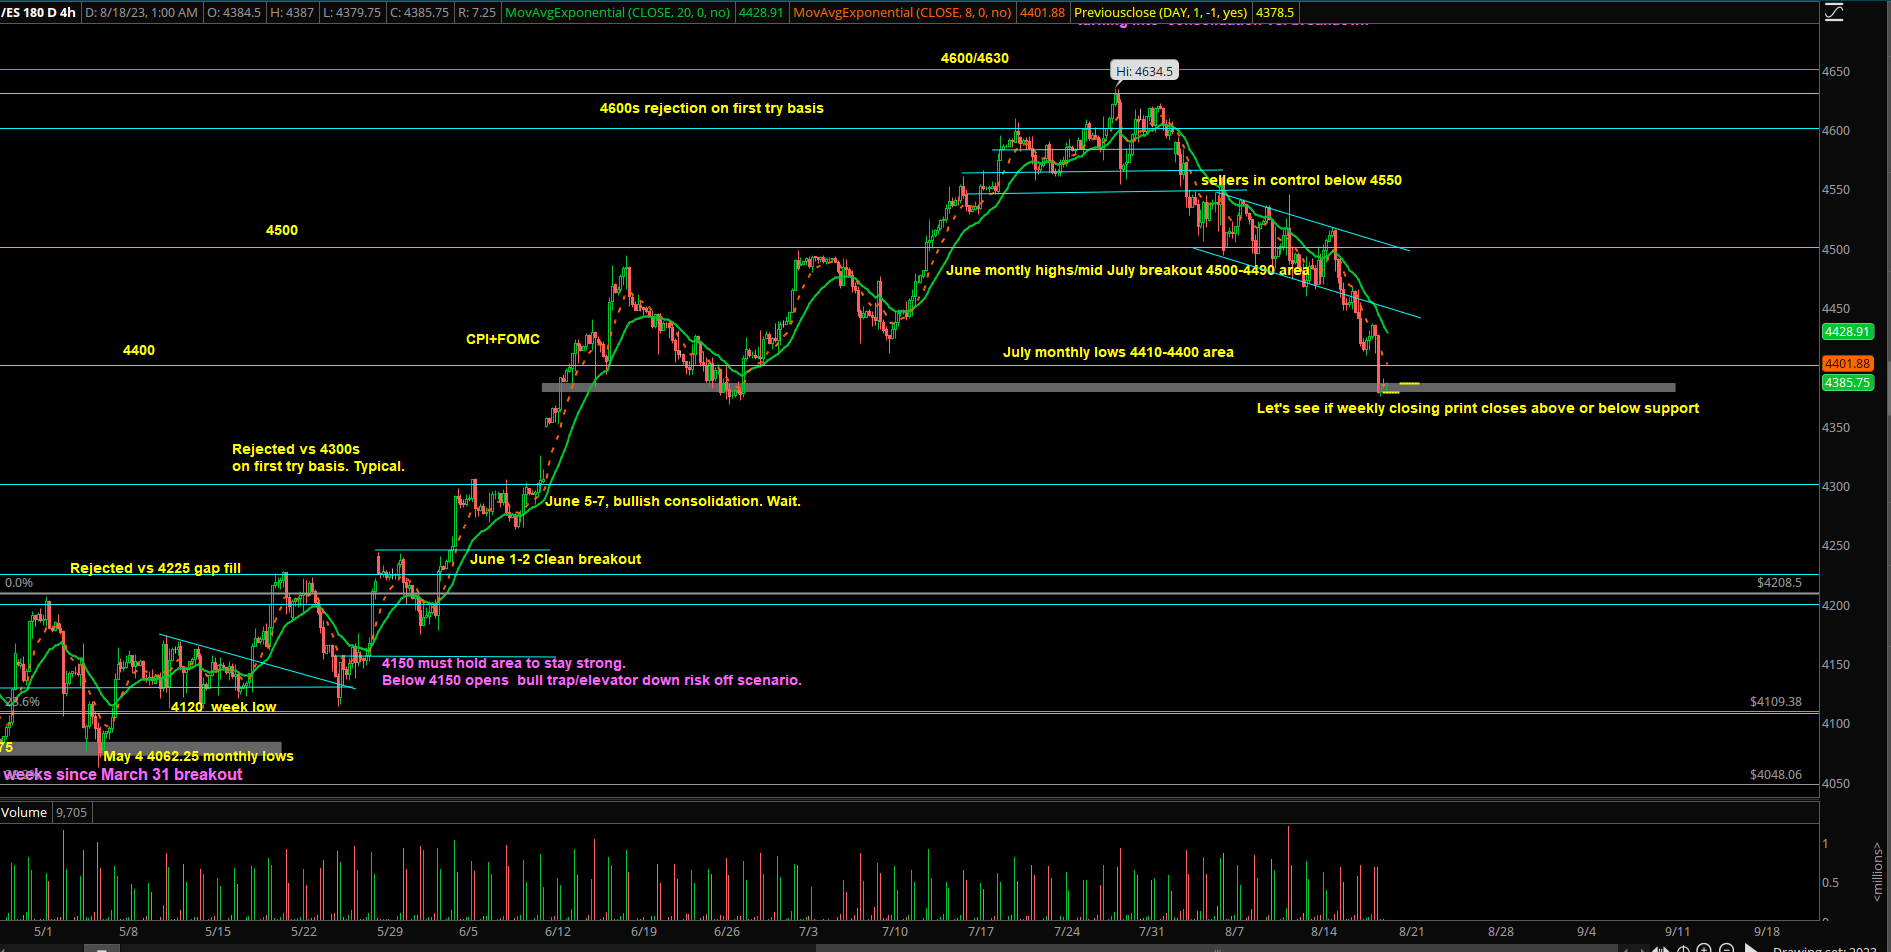
Thursday played out as another trend day down, where price topped in the 4430s on the Emini S&P 500 (ES) and closed the day at the 4380s lows.
Friday is monthly OPEX alongside with some oversold conditions, so lots of uncertainty. Given it’s been a trend week down, it’s important to observe whether the sellers win it all by closing the week at the lows or we see a stick-save from the buyers.
The main point of contention will be the 4400-4410s area where the latter number represents the July monthly lows. A weekly close below could signify potential risk-off, while a close above could signify a stick-save in progress.
Going into regular trading hours, we’ll be utilizing the immediate resistances of 4400/4410 vs. the 4385-4375 current lows zone to look for our next intraday opportunities. As it’s been a trend of three down-days in a row, we’re on the continued lookout for selling exhaustion/climax, especially when paired with higher timeframe just retested the 4370s WEEKLY 20EMA (strong uptrend support).
At this point, a break and hold below 4385-4375 opens further downside towards 4365/4350/4338. This would be the unhinged scenario…quick sand mode.
A break and hold back above 4400-4410 could be the start of a temporary bottom given higher timeframe buyers are trying to defend this zone ahead of next week. Then, it would open up 4345/4444/4450.
Bonus: Traders also need to observe NQ, which tested into the July monthly lows of 15060s-15100s last week. In addition, a major round number like 15000 has a lot of eyeballs on it, so this area is a critical area for price action to react. Need to see if responsive buyers continue to defend this area or sellers finally get a follow through and sell hard. An important reference point to gauge momentum and react accordingly. (Note: Wednesday Aug 16th finally broke below 15k, so support has turned into resistance. Observe how it backtests. Thursday backtested into 15k and got rejected hard into a low of 14730s. We’ll be on the continued lookout of using 15k as a short-term momentum gauge.)
Extra notes: August seasonality for S&P is usually chop-chop within a range, with an average of 0.1% August monthly gain over the past 20 years. Then, September is one of the weakest of the year. We’ll monitor if S&P continues to follow seasonality as it’s been a good guideline for the year thus far.