MM Weekly Outlook: Tsunami Alert
 By
By
In last week's outlook for this week, it was noted that a two week sentiment pattern was concerning as the very rare pattern that accompanied 9/11 happened to be the current sentiment pattern. Nothing especially "game changing" has yet been noticed to have occurred. Furthermore, because of the fractal nature of what is being observed, when a significant pattern is noted on a longer term scale, such as weekly, it is anticipated to show up on the daily scale charts as it "lands." This has not happened yet. Nothing similar has of yet shown up on daily.
It's impossible for me to imagine "nothing" happening with this. The kinds of events that would be anticipated to accompany this type of pattern would likely be either 1) Death of a significant world leader whose loss is widely felt. 2) Unusually impactful mass casualty event. Whatever it is would be game changing. It would likely mark a before this and after this moment.
The best I can account for this is that this is similar to a tsunami on approach that hasn't landed yet. Like a tsunami, it can't be seen from the air and is essentially invisible until just prior to landing. It just so happens that the coming week's sentiment pattern can accompany panic type events. Is this when it "lands?"
I will continue to watch the daily data for anything that stands out. As for now, I can only issue an anticipatory "tsunami alert." Be on watch. Until then, enjoy the water and the day at the beach.
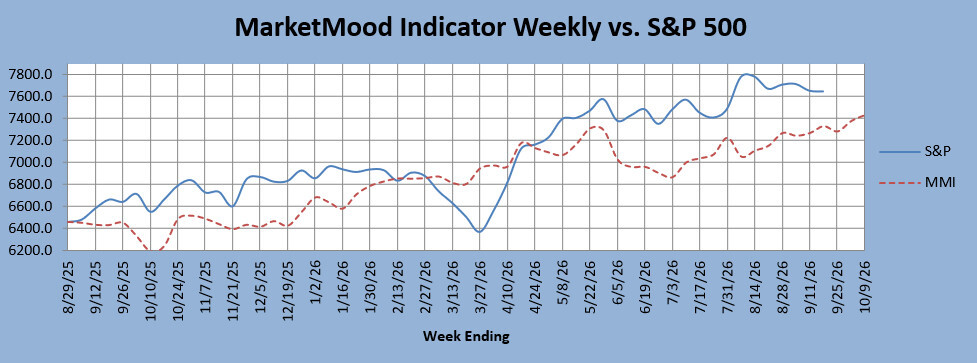
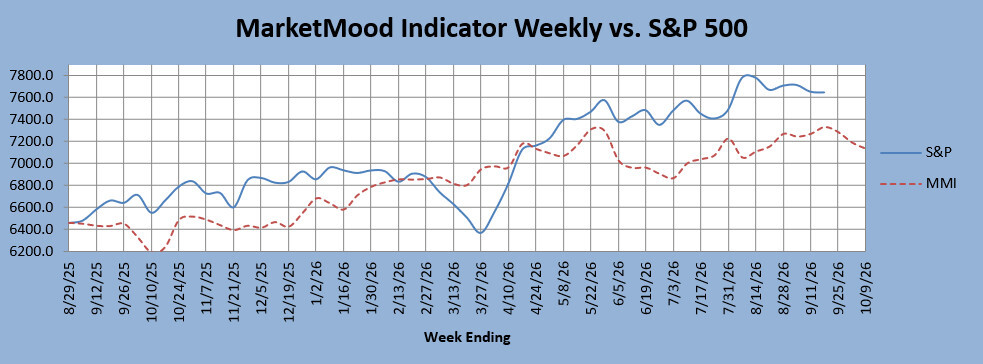
We have two versions of the MMI vs S&P chart due to a potential flip in a couple of weeks. One continues to show a generally upward trending slope of the sentiment line, with no lasting trend change on the horizon. The other clearly shows a downward trend change. We'll see which one plays out.
Latest weekly MMI vs. SPX charts:
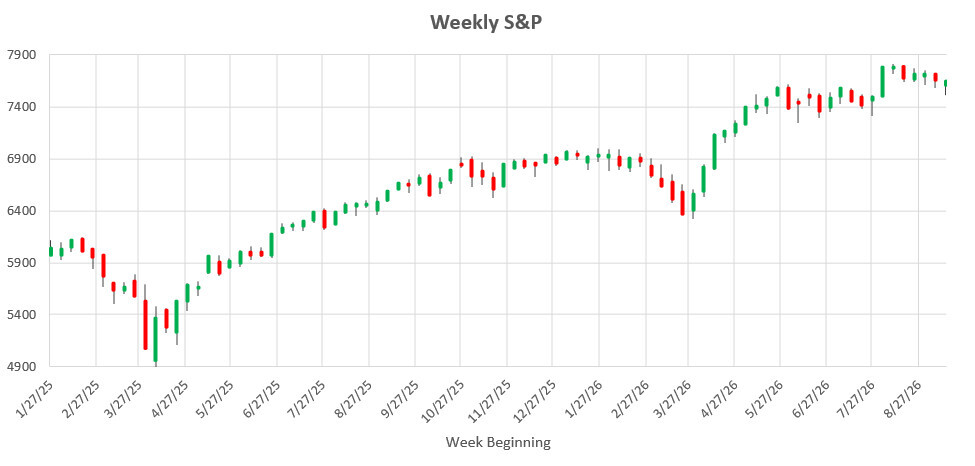
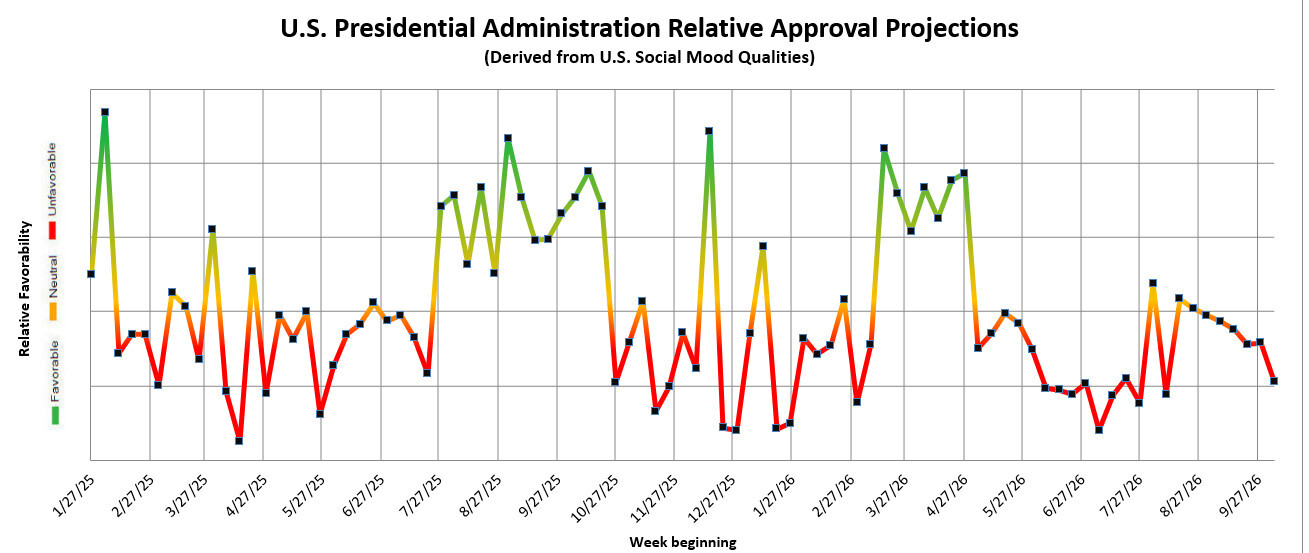
The week's candlestick chart reflects a market had clearly broken out from a long sideways pattern but continues to take at least a moment to pause prior to further upside. Interestingly, this sideways-downish move these last few weeks highly resembles the sideways-downish move on the Presidential Favorability Projection chart.
The Presidential Favorability chart (below) shows the relative favorability (relative vs. opposition). This past week, projected favorability continues a slow fade within neutral territory, finally breaking into the unfavorable zone in the coming week. With trade signals a week behind, System 1 will be continuing short, and Systems 2 will be joining it by the end of this week. System 3 will continue to stay on the sidelines. Currently, the System 1 hypothetical short trade is down about 146 SPX points from entry at open on Aug. 3.
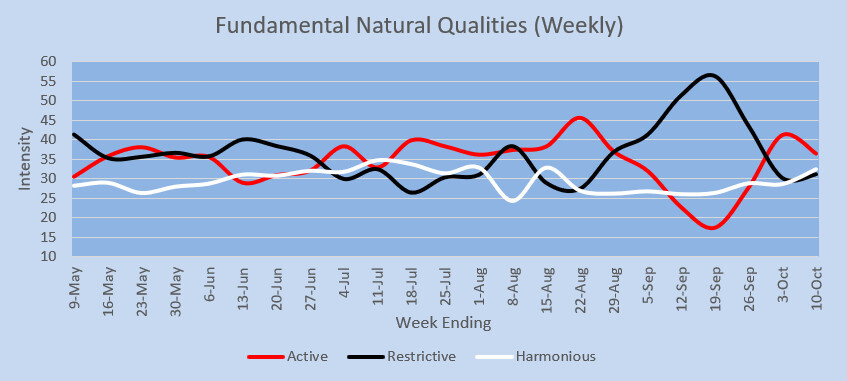
Finally, the new "Natural Qualities" chart is implying a relatively inauspicious or disharmonious period through the first three weeks of September.