MM Weekly Outlook: Potential for Economic Turbulence
 By
By
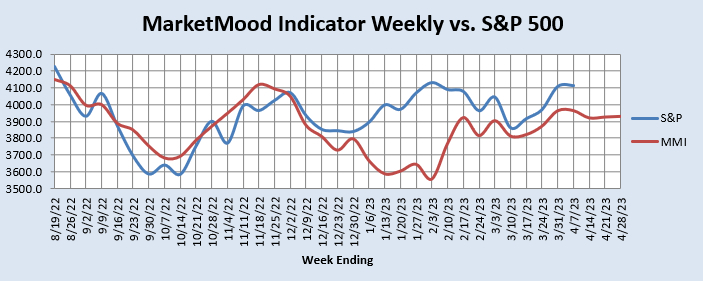
The tentative monthly outlook has us looking up in April until a possible abrupt shift has us looking down through at least some time in May. In order for a potential April or May crisis to be anticipated, I would first want to see a crisis-like pattern in the weekly outlook and then eventually in the daily patterns. The weekly data is now filling out a chart through the end of April and while there is a spot announcing some potential for economic turbulence, it is not as clear as I would like to confirm the severity of what the monthly charts were suggesting as a possibility.
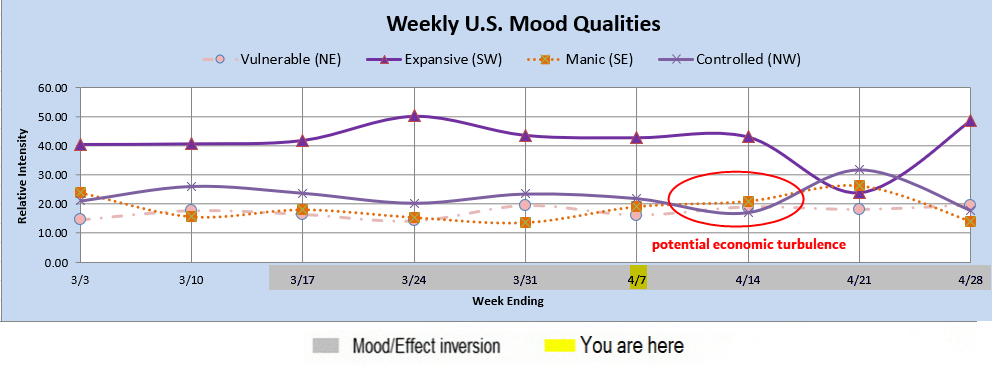
The weekly mood pattern in the chart above implies a higher likelihood for such turbulence in the April 10-19 timeframe. As of this posting, the daily data only goes through April 10. MMI (daily) is portraying Monday as a likely down day with a mood pattern that reflects a serious mood and the potential for sudden change. That has some overlap thematically, but a one day negative turn is not enough to confirm a monthly scale shift. Nevertheless, even though there is no confirmation at this time, it definitely warrants a close watch and additional readiness to respond during this timeframe. The latest weekly MMI vs. S&P 500 forecast chart is shown below: