MM Weekly Outlook - Market Analysis for Apr 28th, 2023
 By
By
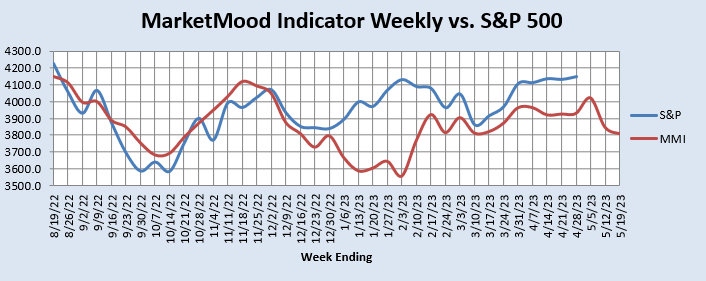
There are apparent divergences in the longer term trade indicators from the daily MMI and what the weekly chart is portraying. Looking at the weekly chart, there is an upcoming top as soon as sometime next week. Yet, the long term trend indicator is long term bullish, in a long trade from 4138 SPX (cash index) and the more than swing Hi/Lo Trader is long from today's open at 4129.63 betting that a major low is in. It is possible that the trade signals could change next week to "exit trade," we'll see.
The latest weekly chart is below: