MM Big Picture Outlook
 By
By
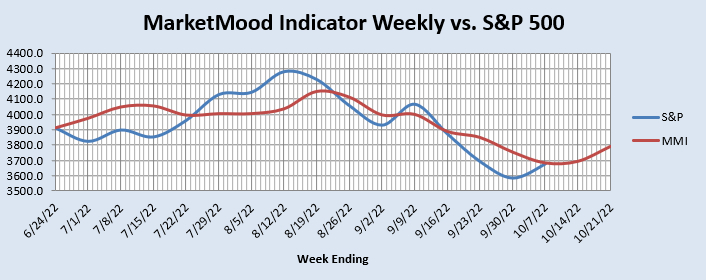
The major low signal from end of September will be considered satisfied with a "low likely in" confirmation if today's S&P 500 closes above 3690. With the market well above that, there's a very good chance for this to happen. However, with the recent major low invalidation signal and what is being observed in the longer term charts, it's still premature to celebrate a lasting low.
Next Week is Critical:
The weekly mood pattern for next week is "green shoots." This is the exact pattern that showed up in March of 2009 that allowed us to call the lows of 2008-2009 market crash in our weekly publication of that period. However, there is a snag this time. There is a potential for a flip or inversion next week. That would cause green shoots to turn sour into a "crisis/disaster" pattern.
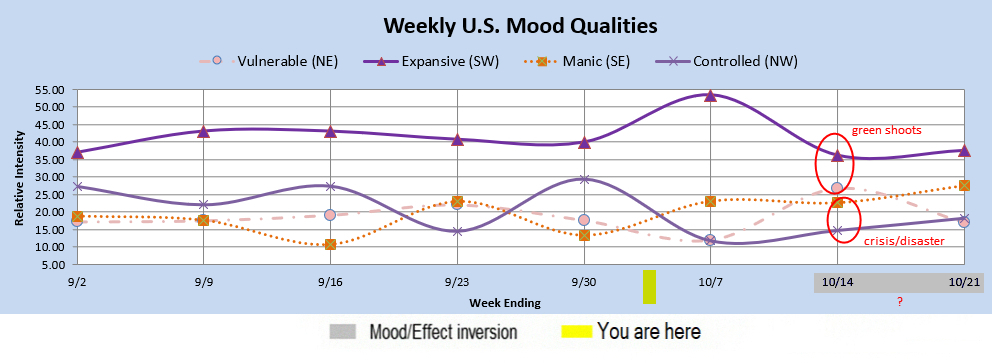
This is the weekly stock market chart (as of October 4) without a flip:
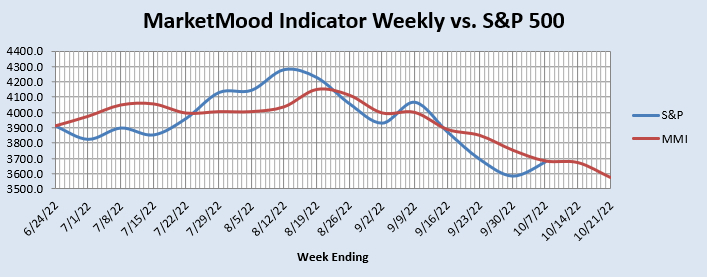
This is the weekly stock market chart (as of October 4) with an inversion hitting sometime next week:
The Monthly Outlook:
We've seen a lot of those "crisis/disaster" patterns in the last couple of years, so by itself it's part of an unfortunate new normal. Yet, zooming out to the monthly chart we see a potential for more concern. In the chart below, the month of October IS a crisis/disaster pattern. This occurs in a context of nuclear threats from Russia's Putin, and escalatory missile launches from North Korea. It's also the period leading up to U.S. elections which has its own potential for trouble spots.
The only consolation perhaps, is that the defining characteristic, the Manic and Controlled mood qualities very close together with Controlled on top is so close that it might be considered within the margin of error for a month of daily data points added together. To give some room for hope, and for my own peace of mind, I am allowing for the possibility of its opposite, the pattern with Manic on top which points to positive or helpful government responses to a crisis such as the assistance efforts we are currently seeing in Florida and Puerto Rico, or what might be experienced as relief by markets with a pausing of interest rate hikes. There's also the potential that both may be true simultaneously during the span of the month-- crises and responses.
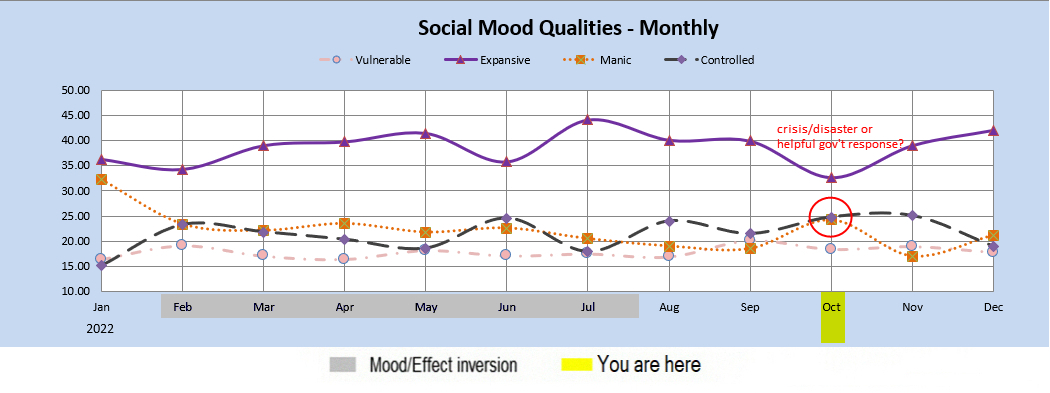
Yet, in spite of my attempt at consolation, MMI calculates the likely market movement based on which one actually is on top. This is the latest monthly forecast as of today (October 4) zoomed out and close up:
While it may look ominous, because of the ambiguity surrounding which very close together dots are on top, it's important to confirm this outlook with our shorter term charts. That's why next week is so important. Green shoots or something very much not that. Which will it be? Stay tuned...
