Lululemon: Stretched And Ready To Bounce
 By
Levi
By
Levi
There is a setup present for a bounce in LULU shares. And, we also have what could turn into something more than a bounce. What is our basis for this affirmation and what are the specific parameters that will provide guidance going forward? Let’s look at the fundamental snapshot with Lyn Alden and then study sentiment via the structure of price on the chart.
Recently Lyn shared this key point with our members regarding the current valuation:
“LULU has a strong balance sheet and is getting into very deep value territory, but it needs technical confirmation of a bottom to build more conviction that it's not a value trap.” - Lyn Alden
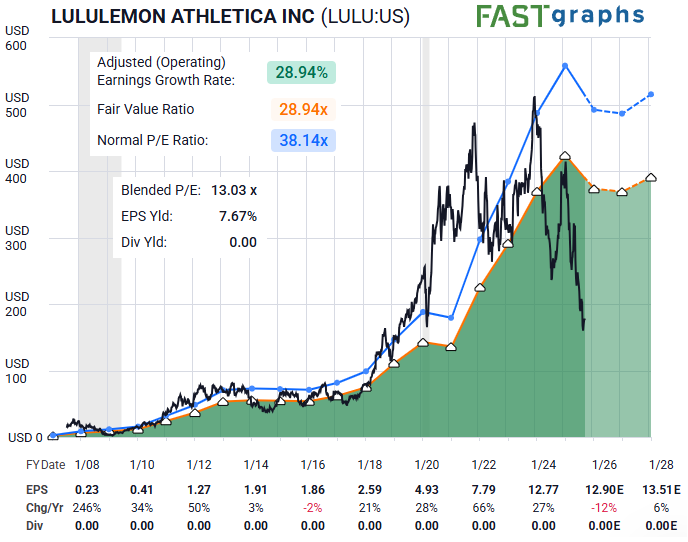
Just a brief glance at the LULU F.A.S.T. graph quickly confirms that shares have not seen this valuation level for some time. However, as Lyn so astutely cautions, there is the scenario where shares journey a continual spiral down as the stock reaches even cheaper than before.
How might we know when a turn is likely and then, what would confirm that a more important low is in place? Let’s see what sentiment is telling us here.
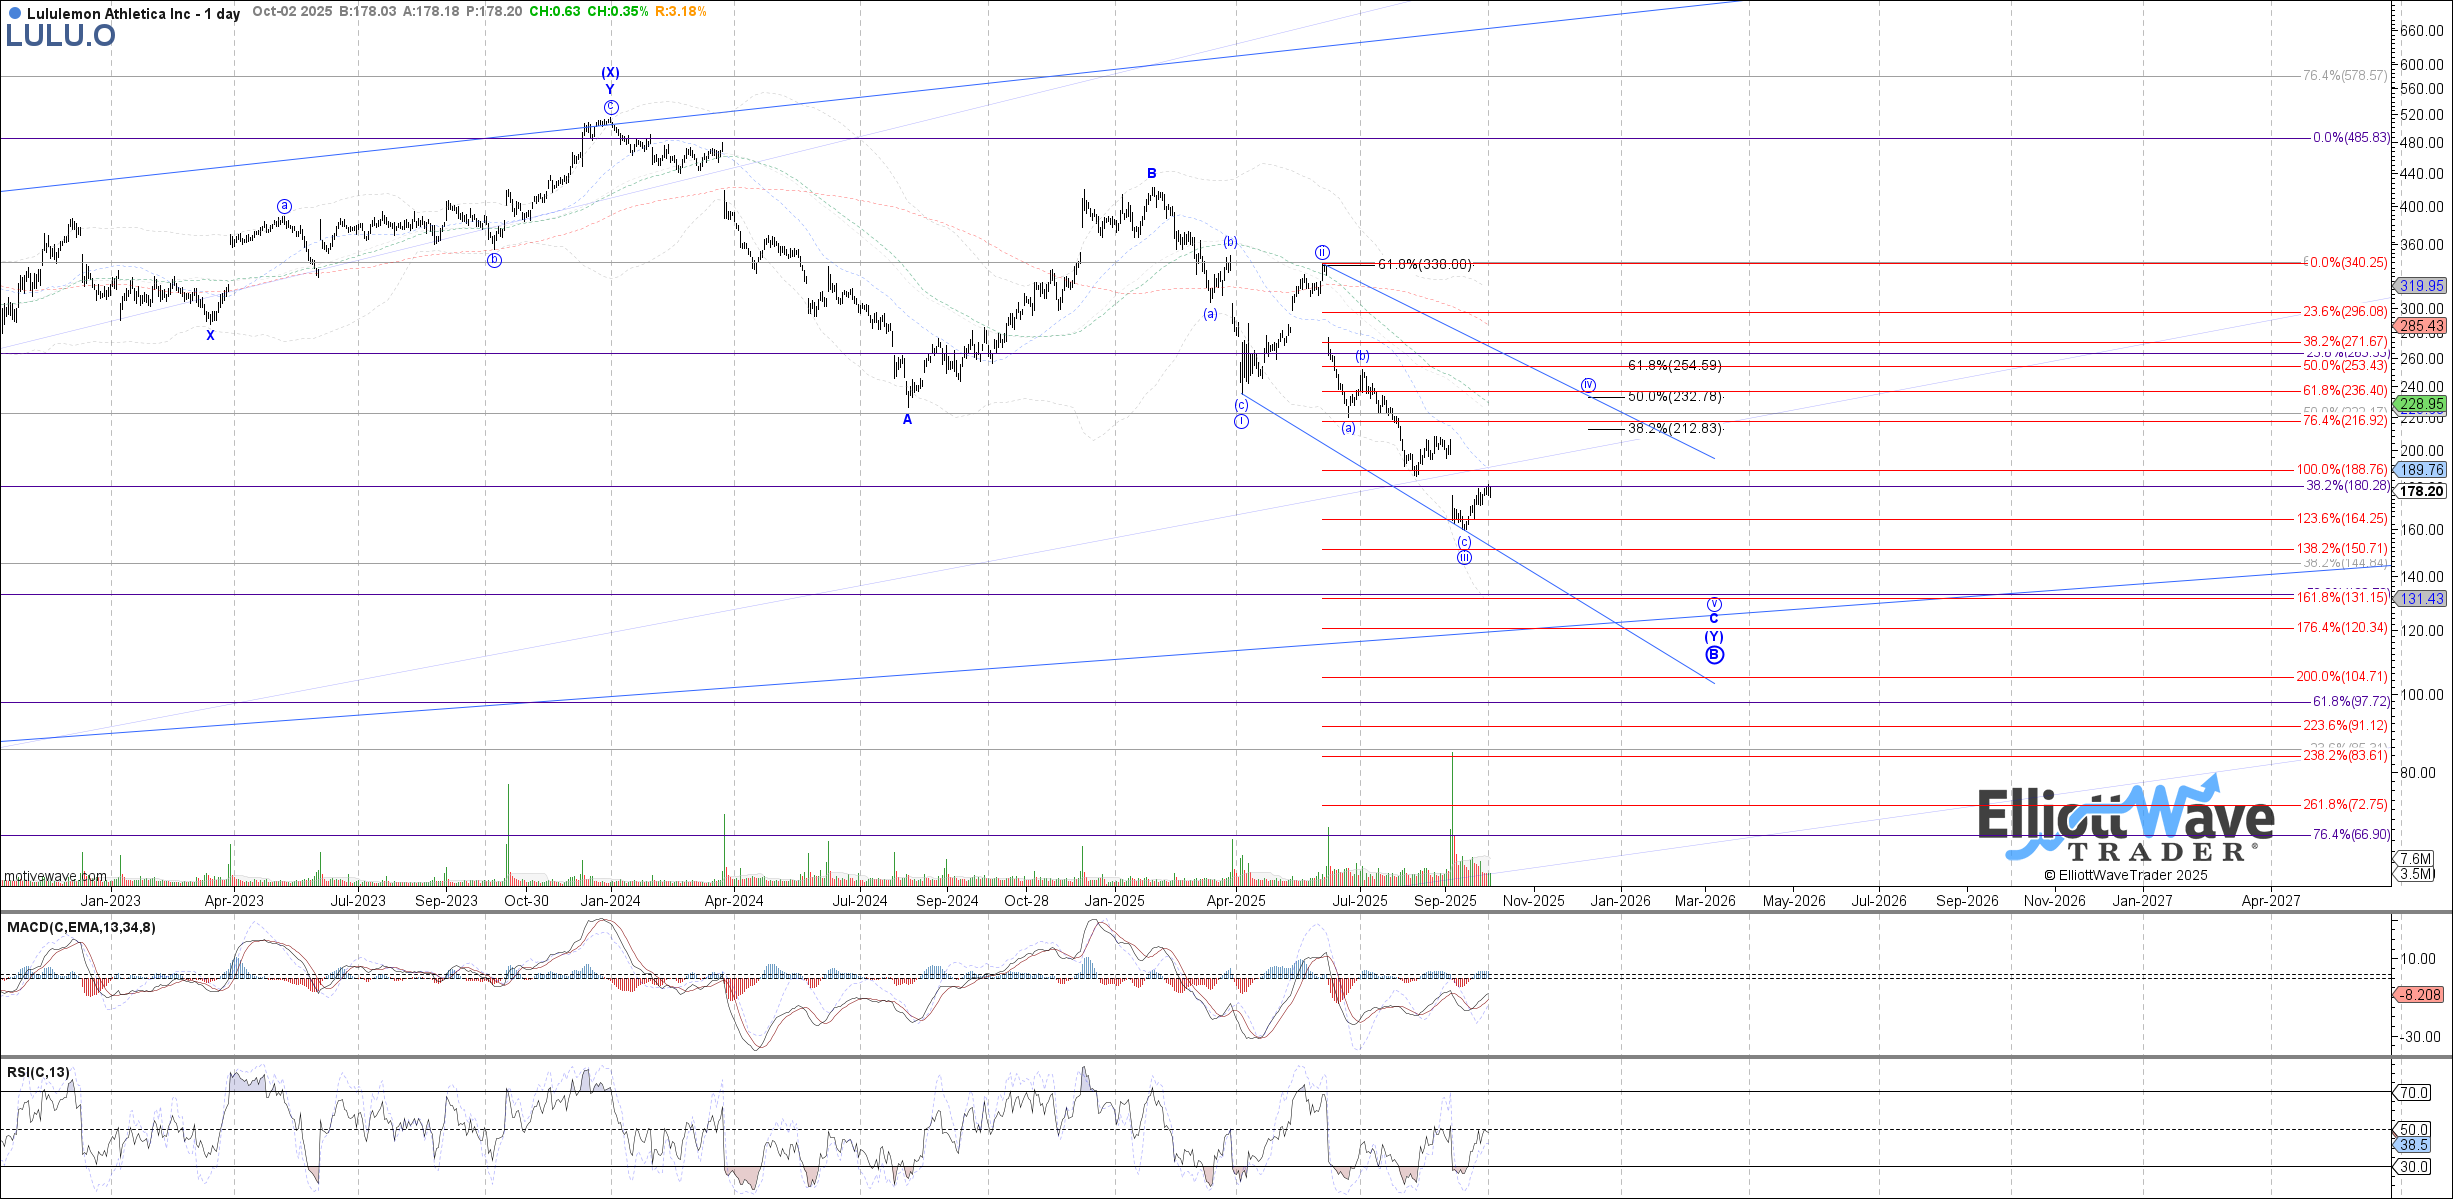
Both Zac Mannes and Garrett Patten are showing the likelihood of at least a near-term bounce. On each of their respective charts, price appears to be finding its footing and should retrace part of the recent decline. How much might that be?
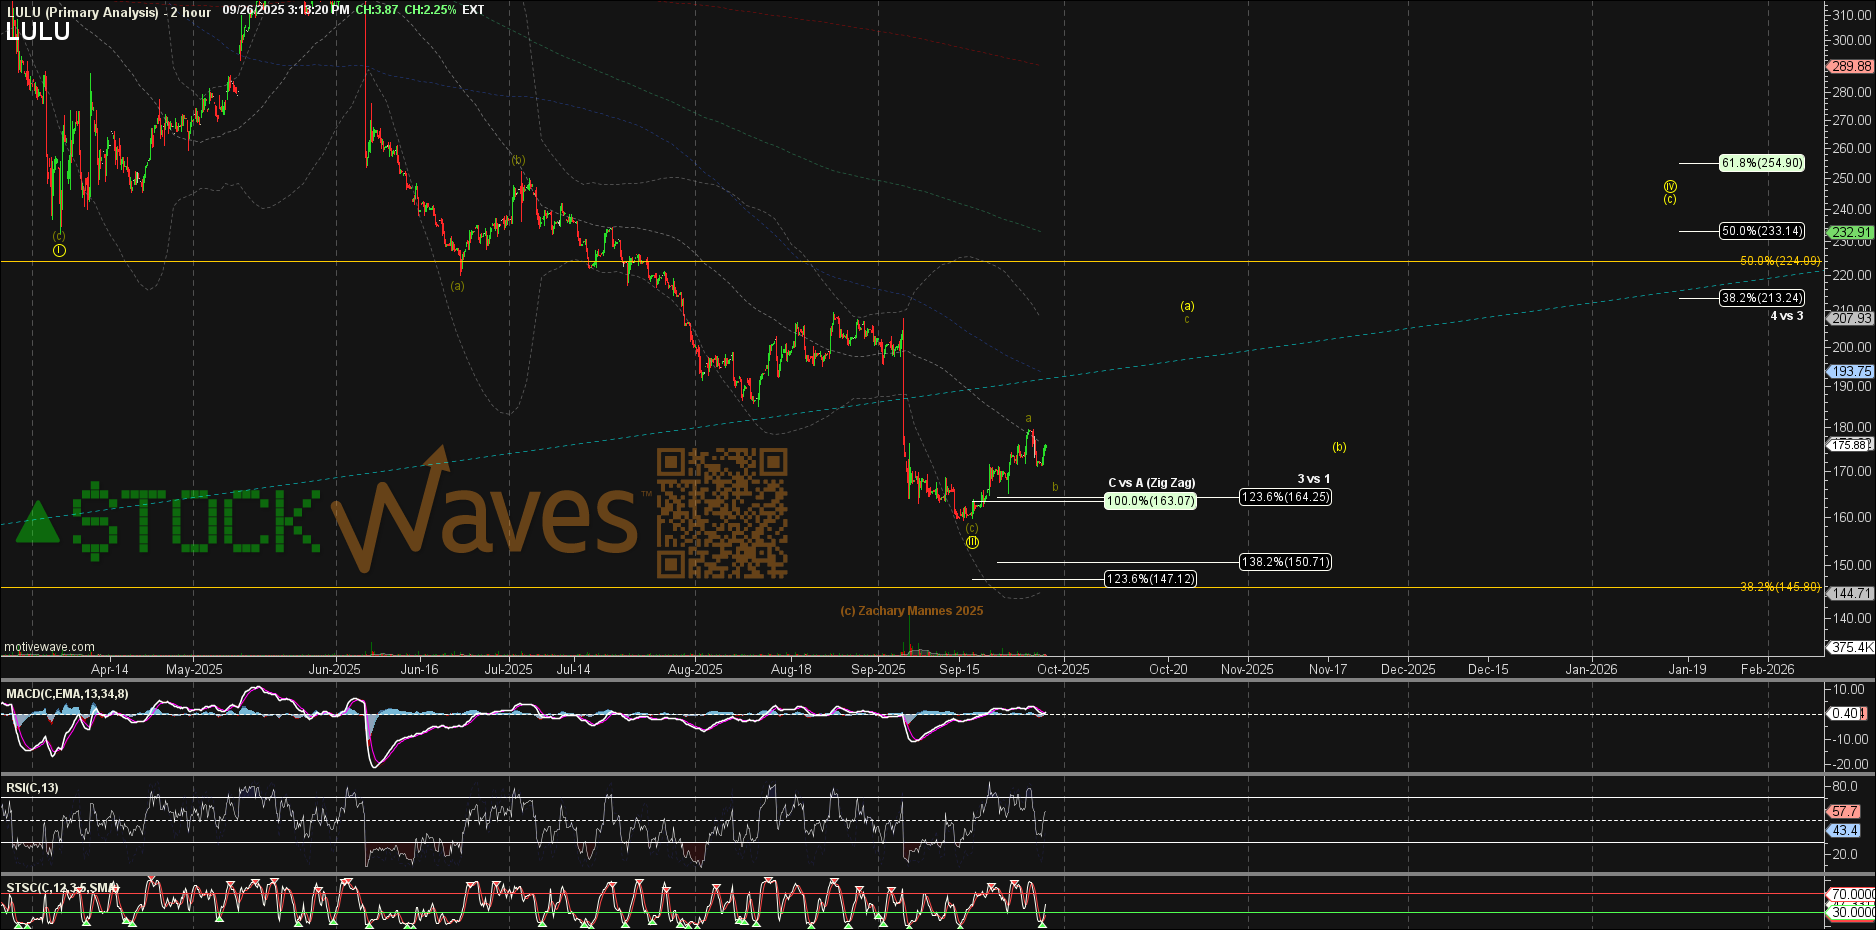
I want to introduce a concept that we use in possible positioning for trades much like this one. There are moments when what appears to be a third-wave low is actually the bottom, and price proceeds to bounce — and then some. Colloquially we have coined this as “more than a four” - meaning that what was supposed to be a fourth wave corrective bounce in reality turns out to be a larger rally instead. Is that what will happen here?
What might that look like? As you can see on both charts, Zac and Garrett are anticipating a move up to perhaps as high as $233-$255 over the next several weeks. The structure of this move is likely to be corrective in nature, meaning price action may be choppy, with some overlap of prior waves. Here’s what we want to keep in mind: when correctly applied, Elliott Wave helps identify favorable setups. These setups are not certainties - just as projections aren’t prophecies. Rather, we follow the probabilities and we also identify when the scenario requires refinement or where it may even invalidate.
In the case of LULU shares, we have a solid base for our thesis as described above. Price is cheap relative to past performance. And although we do not have the guarantee of future returns, shares are a bargain at the moment. As long as price stays above the recent low near $160, we anticipate a near-term rally. From there, we will let the structure of price dictate if there is to be more than a four. Breaking above $255 would be a strong indicator of this and ultimately a move back above $340 is the confirmation of an important low already in place.
