Low of the Week Structure
 By
Ricky Wen
By
Ricky Wen
E-mini S&P 500 Futures: Keep It Simple Stupid –Low of the Week Structure
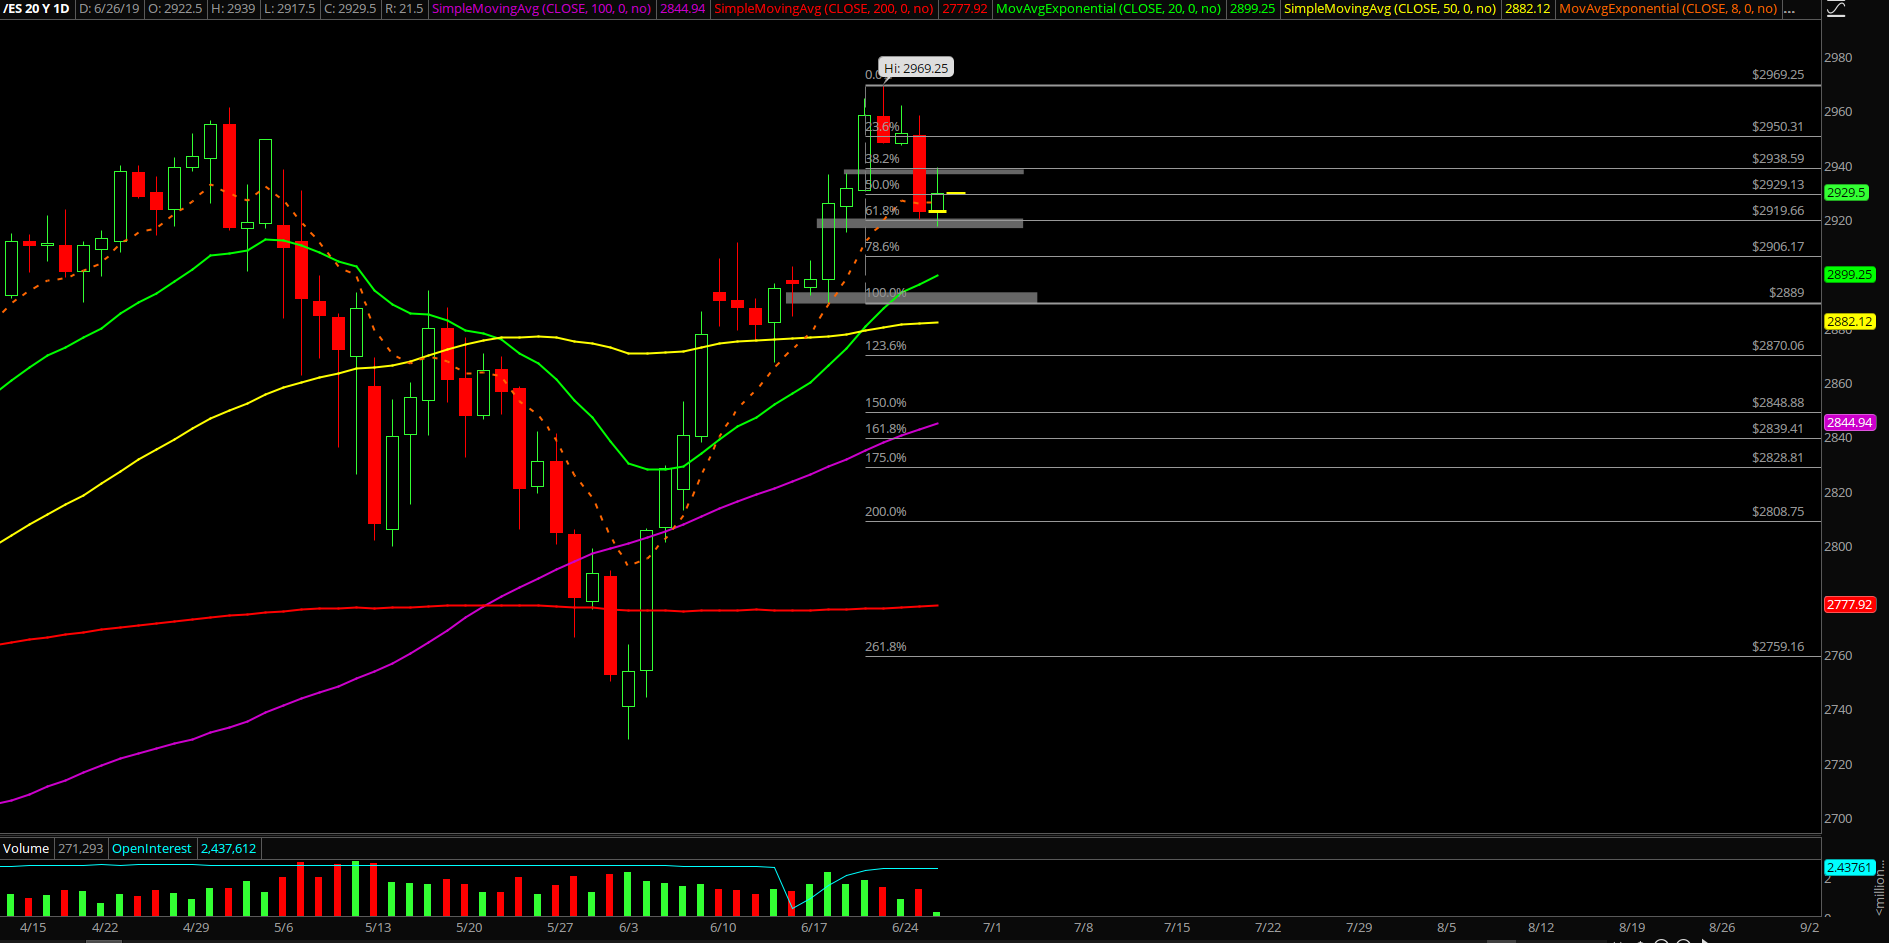
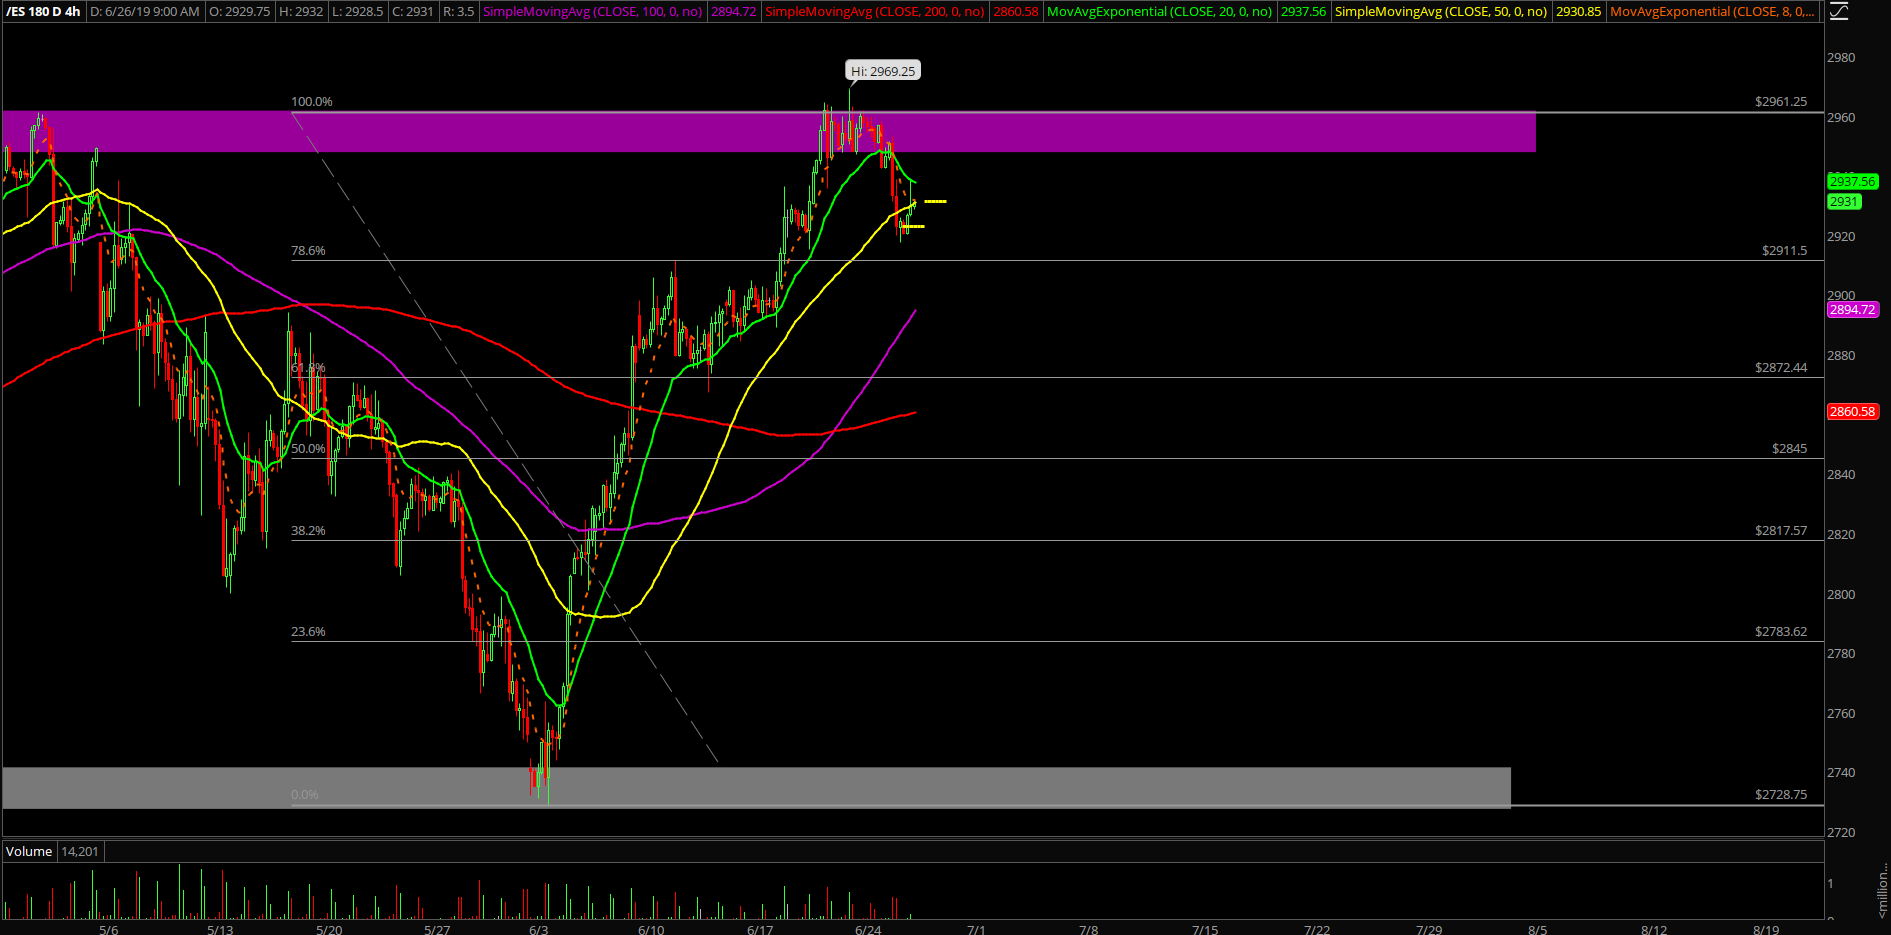
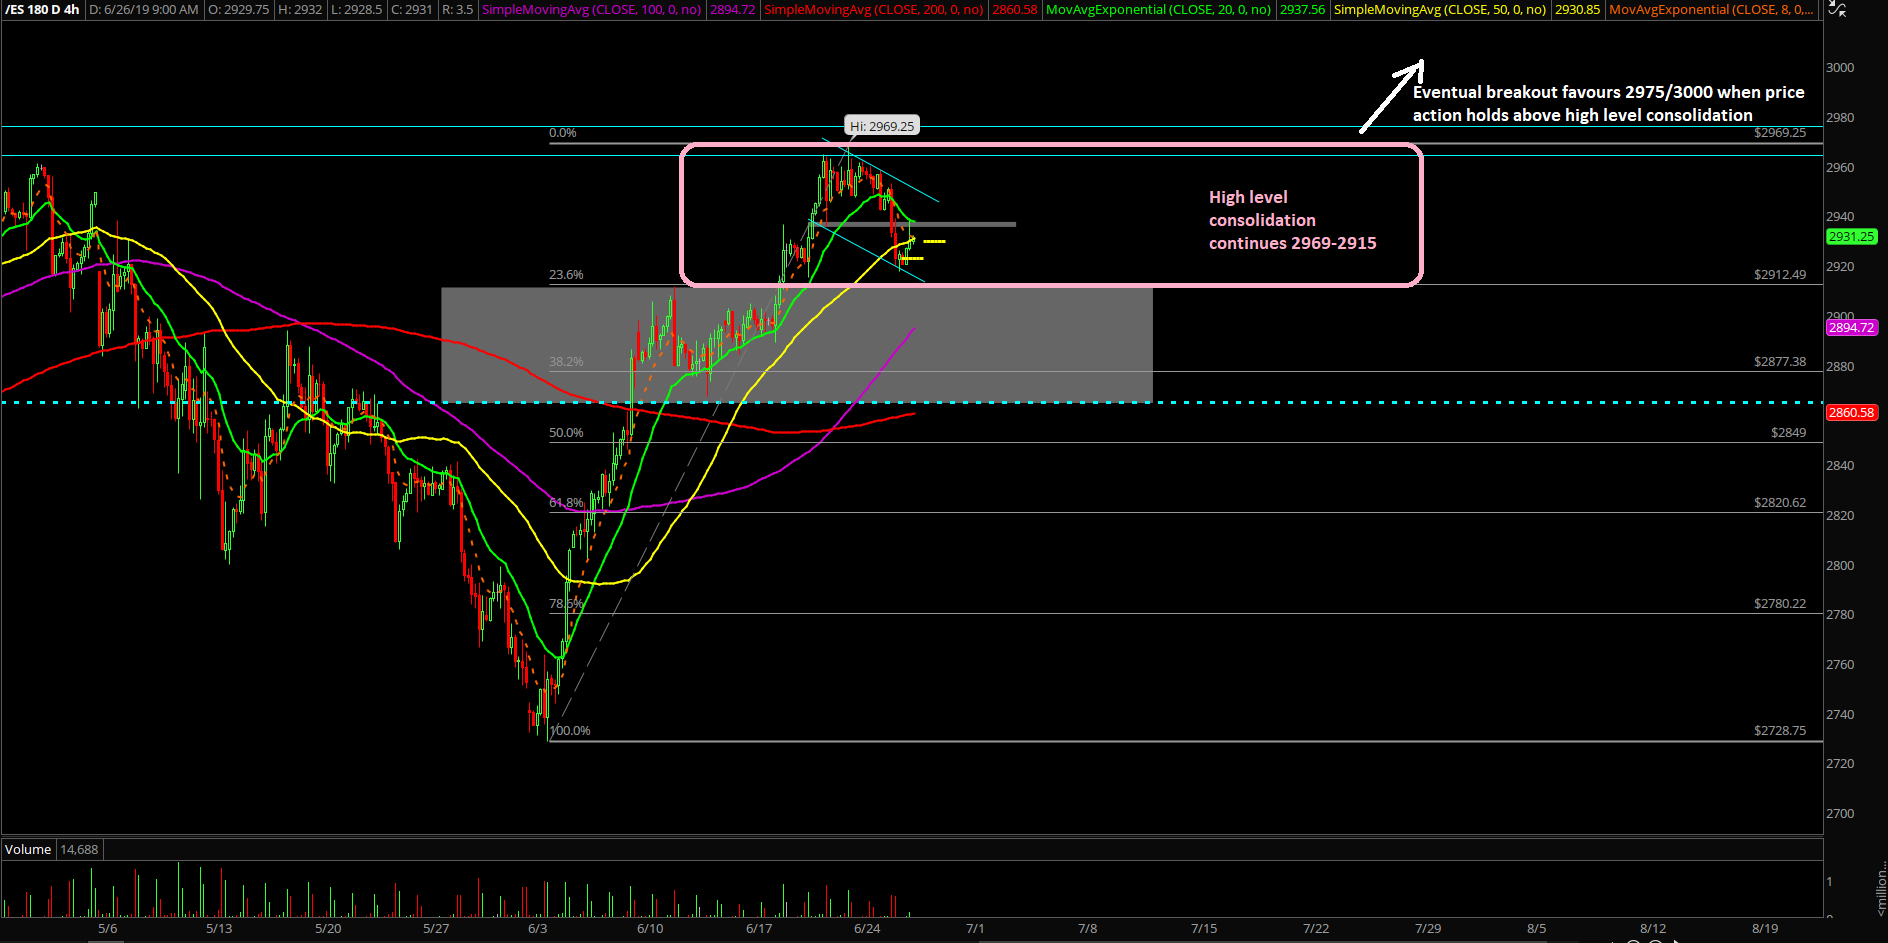
Tuesday’s session was fairly textbook as price action decided to backtest into the lower end of the overall overall high level consolidation 2969-2915. If you recall, the market dropped about 10 points as soon as the RTH bell rang and the intraday bears took over to test the pre-determined support levels one by one. Overall, the high level consolidation is close to finishing per our expectations since the weekend KISS report.
The main takeaway from this session is that the bull train is giving us a clear risk vs reward opportunity into the end of the week dead highs attempt. Essentially, the market is producing the low of the week setup week or something else is occurring if dead wrong based on the levels and odds.
What’s next?
Tuesday closed at 2923 at the dead lows of the session as price action is hovering above a key trending support of pre-determined 2915 level. Key time because this is the 61.8% fib retracement of last week’s range and basically just a standard ‘hold half and go’ setup on the weekly charts combined with the expectations of the monthly candle attempting a shot at the dead highs by Friday. Nothing has changed in our perspective so we must repeat the main points below.
Current parameters/bias:
- Ongoing breakout is going towards 2975/3000 as short-term extensions, immediately valid when above 2935. Odds start to deteriorate if goes below 2935 because trending support should typically hold at any time during a consolidation.
- If below 2935 could evolve into 2915-2969 high level consolidation range for the time being
- Below 2915 then bears are definitely back in business given short-term trending supports not holding
- Continue to treat bears as stuck in hopium mode and they are only back in business if the 2915 low gets taken out
- Month end is trying to end at dead highs, stay on trend trade setups until further notice.
- Take quick profits as first half of week is expected to be consolidation until price proves otherwise
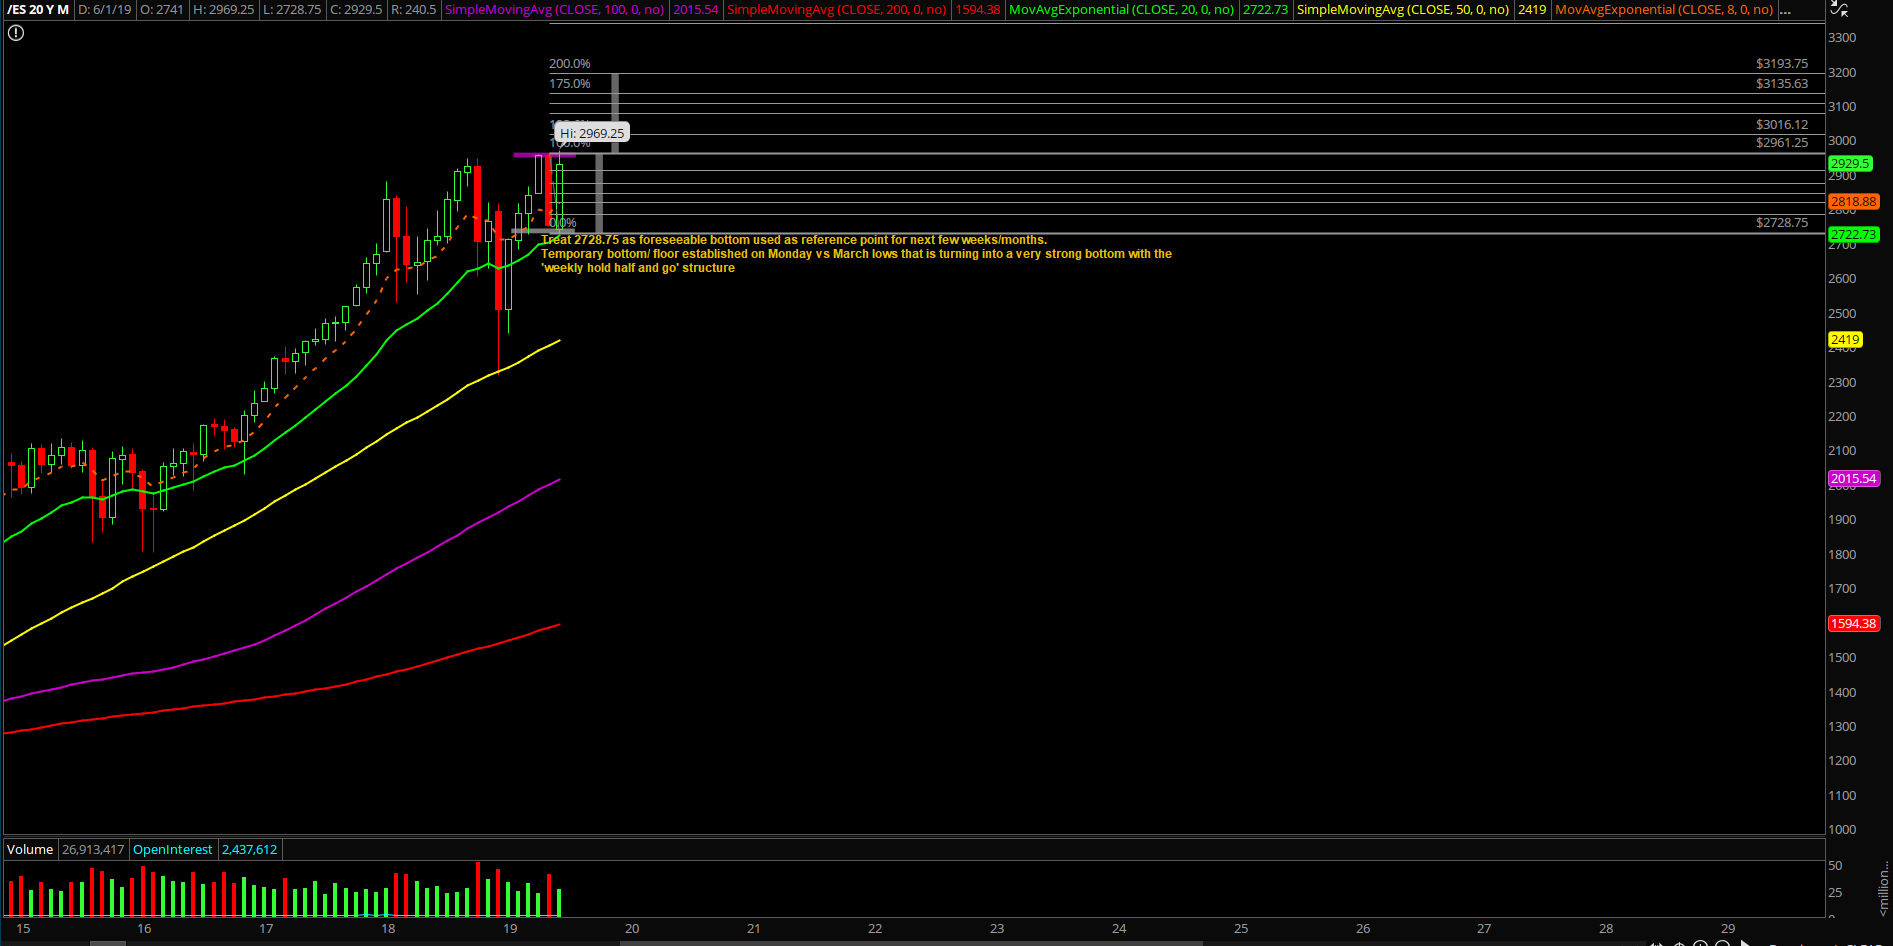
Macro perspective/potential, watching massive cup and handle pattern:
Given that the ES market is less than 1% away from all time highs so it’s time to talk about 3193.75. Where the heck did you derive that random number from? Well, that’s the 100% measured move target of an ongoing massive cup and handle (C&H) formation on the daily/weekly/monthly charts if you zoom out and look closely.
We’re going to be using this number as a reference on the potential range expansion in the coming months given it’s an ongoing bull train from the 2728.75 June lows. To put this in another perspective, it represents roughly +8.4% gain from the current price of 2945 as of writing.
By noticing the overall zoomed out pattern/structure of the broader market, we would be prepared if the bull train keeps extending so we don’t argue vs. the price action. This is quite important because in recent weeks, the bears got slaughtered and so the ongoing massive feedback loop squeeze remains strong and it’s best to be prepared so we milk for as long as we can manage.
Please remember the good old cliché; the market can remain irrational longer than you can remain solvent. This bull train can last a very long time until the music stops and actually breaks key support. If everyday becomes just finding the LOD or higher lows setup so be it. Why argue against what the market is telling you through price action? Just hop on and ride till the wheels fall off, then rotate into the opposing direction when bears get resurrected again by breaking supports decisively.
---
Clear and concise context for June (adjusted some points to be more clear vs the end of May KISS report as price action changed):
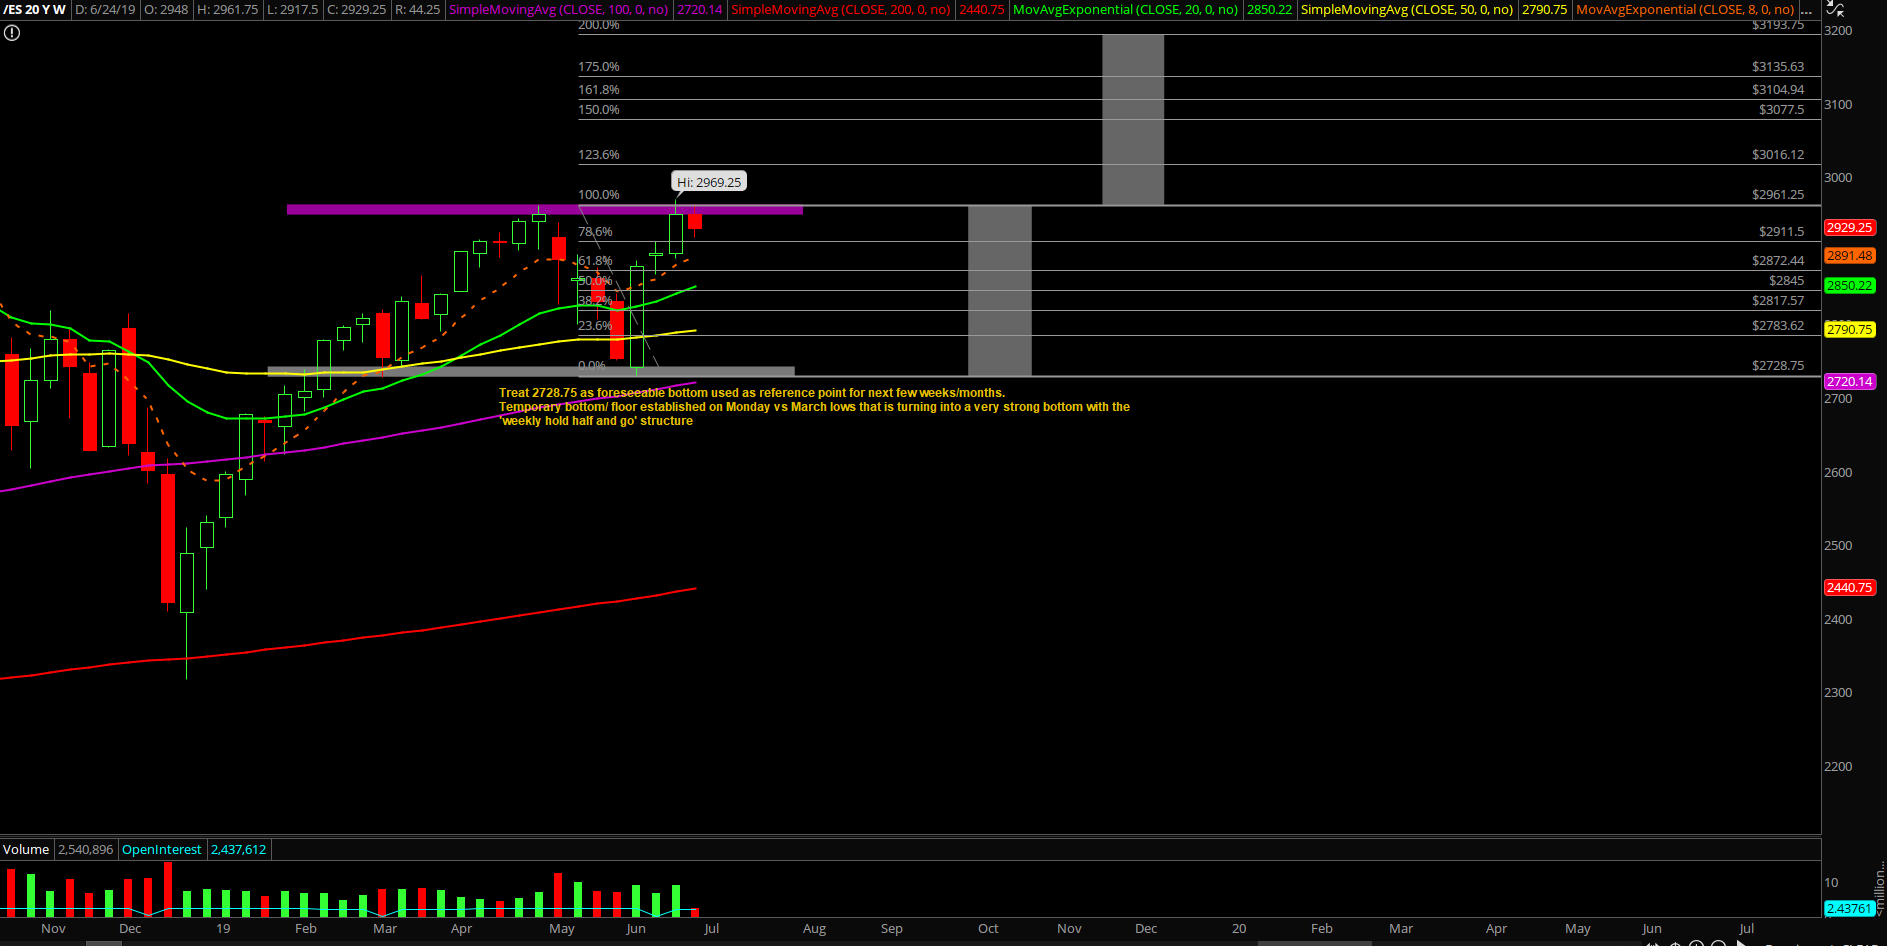
The main takeaway from the first week of June was that the bulls completed the weekly massive bull engulf signifying that price action has retraced all the losses and some more vs. the last week of May. We’re treating this as a standard weekly timeframe ‘hold half and go’ structure for the next few weeks and see how this pattern develops. That means we’re treating the 2728.75 low as the bottom for the foreseeable future and it could very well be this year’s low being in already.
- The market proceeded with the textbook mean reversion playbook that occurred in May and hopefully everybody and their mother were prepared as we discussed with the proprietary signals warning, price action level by level approach and once support broke, the market offered even more clarity.
- The overall process remains similar to month of May, traders must remain 4 steps ahead of the market by being nimbler. Continue to utilize guerilla warfare tactics in order to generate the quick alpha as we have demonstrated so we protect ourselves once again even if the shit hits the fan.